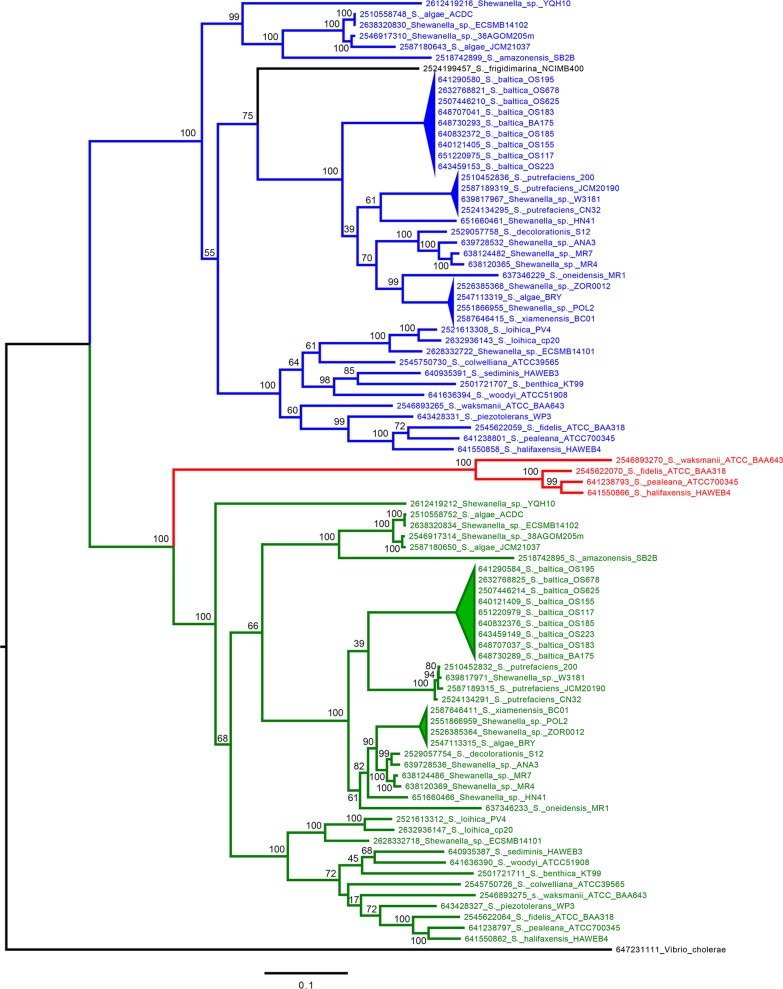
FIG 2.
Molecular phylogenetic analysis of FdhA across the Shewanellaceae. Duplications of FDH regions are separated by clades in either blue or green text. Species containing a triplication of the FDH region are highlighted in red text. S. frigidimarina, which appears to have lost the duplicated region, is in black text. Numbers preceding the species names represent the gene identification number from the JGI database (http://img.jgi.doe.gov). The evolutionary history was inferred using the maximum-likelihood method (300 bootstrap replications) based on the general time-reversible model. The tree is drawn to scale with the scale bar representing substitutions per site. The analysis involved 88 nucleotide sequences, and there were a total of 2,844 positions in the final data set. The evolutionary analyses were conducted in MEGA6 (25).

