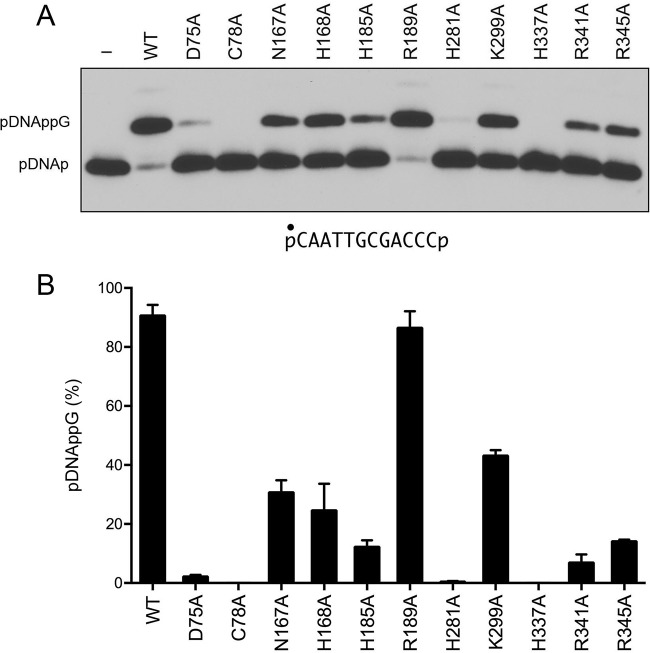
FIG 10.
Mutational effects on DNA 3′-phosphate capping. (A) Reaction mixtures (10 μl) containing 50 mM Tris-HCl (pH 8.0), 2 mM MnCl2, 100 μM GTP, 0.1 μM 12-mer pDNAp (depicted at the bottom, with the radiolabeled phosphate denoted by ●), and either 1 μM RtcB as specified or no RtcB (lane −) were incubated at 37°C for 5 min. The products were analyzed by urea-PAGE. An autoradiograph of the gel is shown. The pDNAp substrate and capped pDNAppG product are indicated at the left. (B) The extents of DNAppG formation are plotted in bar graph format. Each datum is the average of results from three experiments ± the standard error of the mean.

