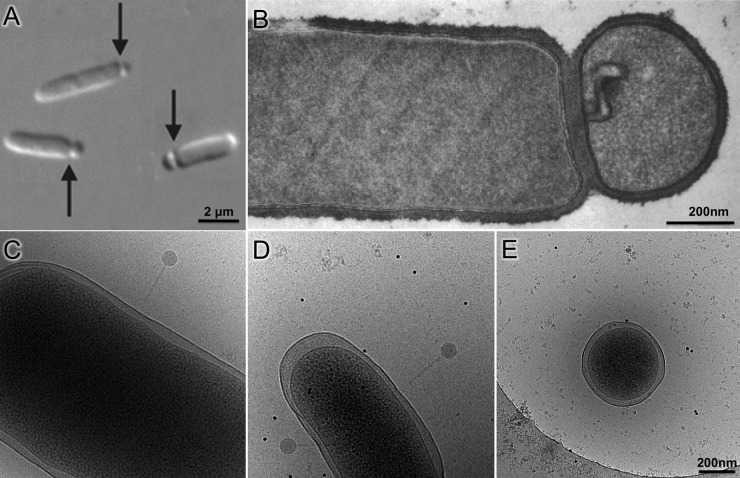
FIG 1.
Bacterial minicell production and comparison of minicells to parent cells. (A) Composite differential interference contrast image of minicell formation through polar division in E. coli. (B) Thin-sectioned negative-stain micrograph of B. subtilis minicell (adapted from reference 55 with permission of the publisher). (C to E) Micrographs of cryopreserved wild-type E. coli (C), skinny E. coli (D), and a minicell (E) generated from the skinny E. coli (republished from reference 61 with permission of the publisher). Phage P1 is visible attached to cells in panels C and D. The scale of panels C and D is the same as that in panel E.

