FIG 3.
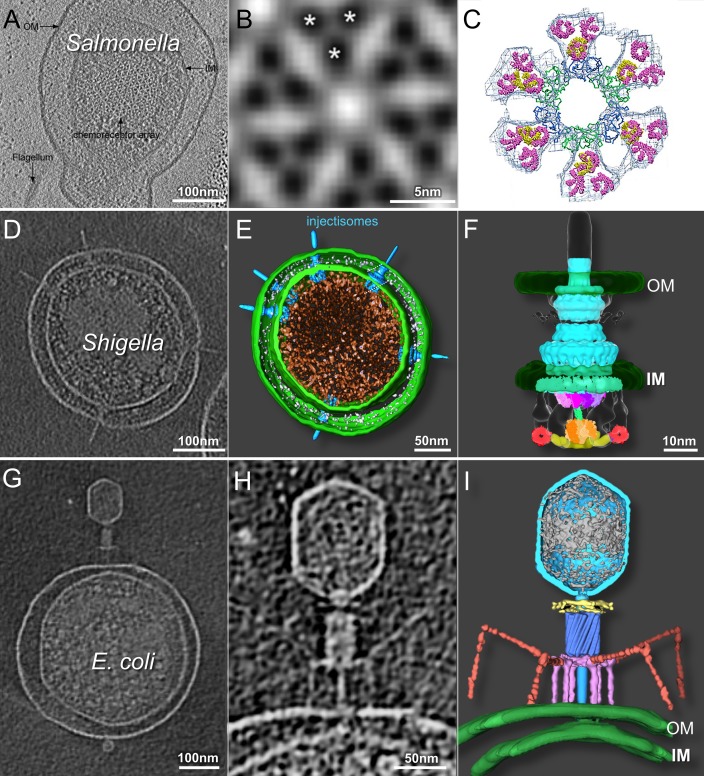
Cryo-ET of minicells provides 3D structures of chemoreceptor arrays, injectisomes, and phage-host interactions. (A) Slice-through tomographic reconstruction of an S. enterica minicell showcasing the top-down view of the native chemoreceptor array. (B) Subtomographic-average structure of the receptor array resolving the organization of the trimer of dimers, as indicated by asterisks. (C) EM density map fit with the crystal structures of the individual components (republished from reference 65 with permission of the publisher). (D to F) Central tomographic slice of a Shigella minicell with multiple injectisomes (D), corresponding 3D surface rendering (E), and surface rendering of the injectisome basal body (republished from reference 78 with permission of the publisher) fit with structures of the isolated components (F) (republished from reference 105 with permission of the publisher). (G to I) Tomographic slice through the center of an E. coli minicell infected with phage T4 (G), magnified view of the same adsorbed phage particle penetrating and transferring DNA into the cell (H), and the corresponding 3D rendering (republished from reference 92 with permission of the publisher) (I). OM, outer membrane; IM, inner membrane.

