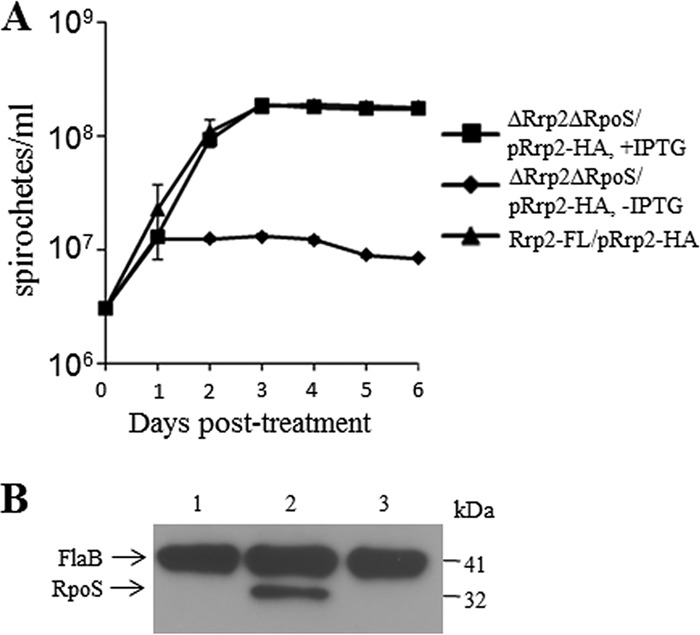
FIG 7.

Growth curve analysis of the conditional rrp2 mutant in the rpoS mutant background. (A) The Rrp2-FL mutant/pRrp2-HA and ΔRrp2 ΔRpoS mutant/pRrp2-HA strains were grown for 6 days in the presence (50 μM) or absence (0 μM) of IPTG. The values in the growth curves represent the mean cell counts ± SD from three independent cultures. (B) Expression of RpoS. Lane 1, ΔRrp2 mutant/pRrp2-HA without IPTG (day 2); lane 2, Rrp2-FL mutant/pRrp2-HA without IPTG; lane 3, ΔRrp2 ΔRpoS mutant/pRrp2-HA without IPTG (day 2). Bands corresponding to each protein are labeled on the left. Molecular masses are indicated on the right.
