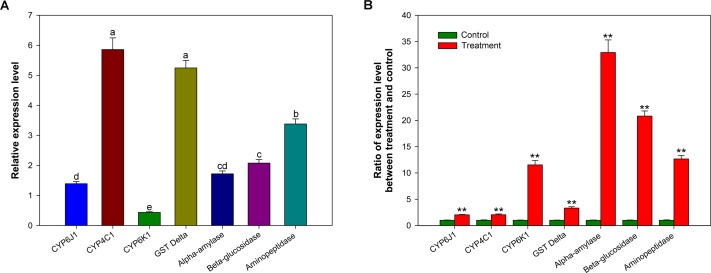
Fig 3.
Relative expression levels of seven selected genes (A) and fold changes in the expression of these genes after cycloxaprid treatment (B) in the P. americana midgut. In (A), different letters indicate significant differences at p< 0.05 level among genes. In (B), stars (**) indicate significant differences between the control and cycloxaprid treatment at p < 0.01 level.

