
Figure 7.
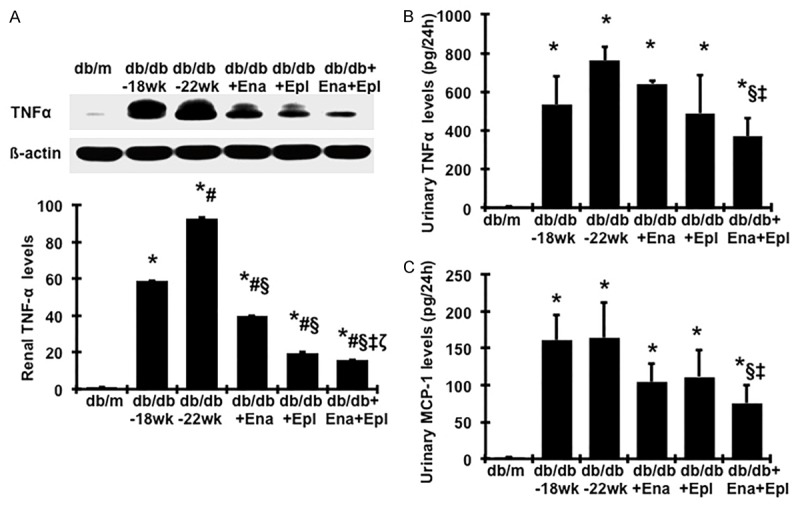
Effect of enalapril, elperenone and combination therapy on protein production of TNFα in renal cortical tissue and urine TNFα and MCP-1 levels. (A) Representative western blots illustrating TNFα and β-actin protein expression. The lower respective graph summarizes the results of band density measurements. Urinary TNFα (B) MCP-1 (C) levels were measured by ELISA. *P<0.05, vs. db/m. #P<0.05, vs. db/db-18 wk. §P<0.05, vs. db/db-22 wk. ‡P<0.05, vs. db/db+Ena. ζP<0.05, vs. db/db+Epl. Diabetic db/db mice were treated with enalapril (Ena), eplerenone (Epl), combination of enalapril and eplerenone (Ena+Epl) from weeks 18 to 22.