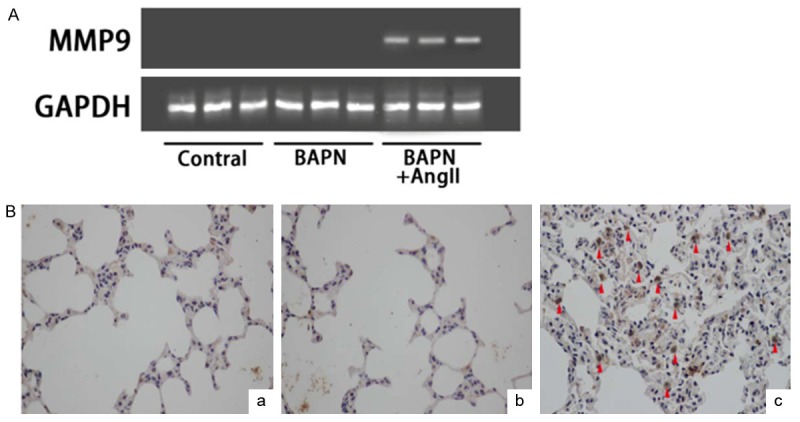
Figure 5.

MMP9 expression in the lung tissues in BAPN+Ang II group. A: MMP9 mRNA expression in each group using RT PCR. B: Immunohistochemistry analysis of MMP9 in each group (a: control; b: BAPN group; c: BAPN+Ang II group). The images were observed under a magnification of 400×.
