
Figure 1.
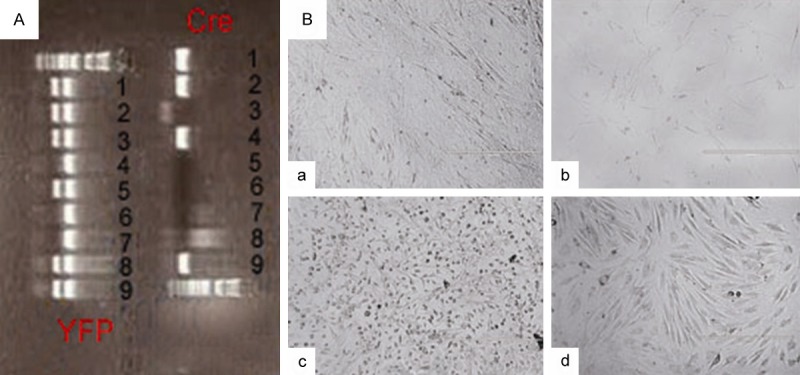
Morphology of OBs and BMMSCs isolated from Cretg/+YFPtg/+ neonatal and adult mice. (A) Genotyping result of 9 mice from the same litter. It showed the expression of Cre in mice of NO. 1, 2, 4, 9 and the expression of YFP in mice of NO. 1, 2, 3, 5, 8, 9, thus we used mice of NO. 1, 2, 9, which were positive for both Cre and YFP, for experiments. (B) Morphology of primary OBs (a) and BMMSCs (c) before sorting and the sorted YFP+ OBs (b) and CD45-YFP+ MPCs (d) (×100).