
Figure 2.
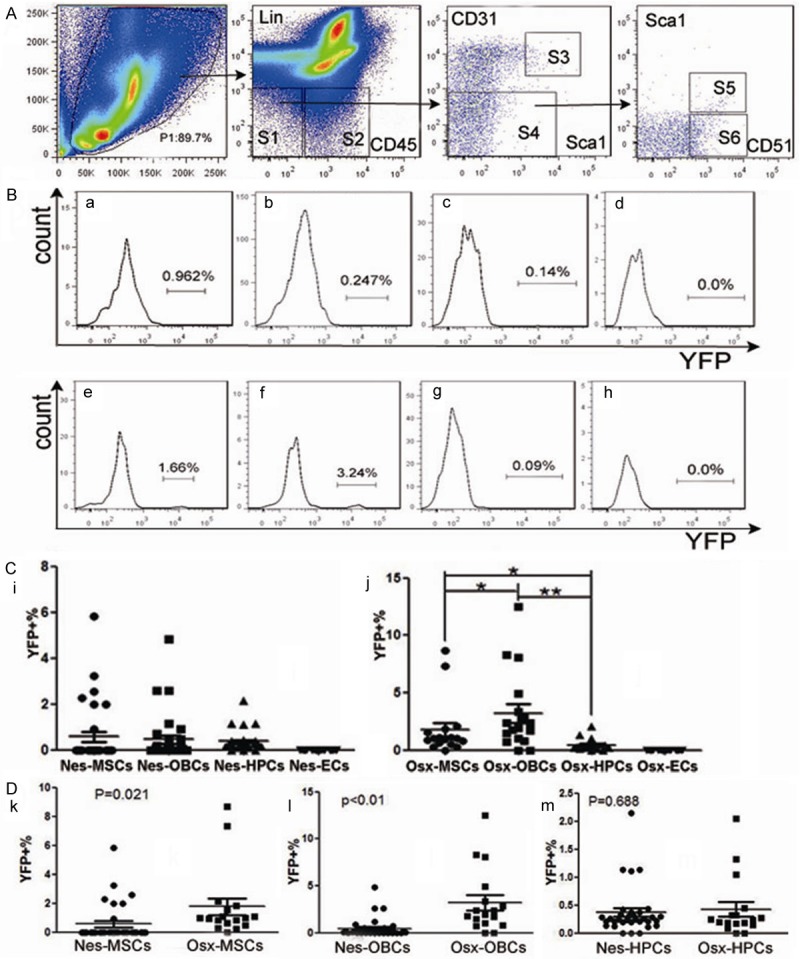
In vivo analysis of the percentage of YFP+ cell population in MSC, OBC, HPC and EC subsets from the BMMNCs of Nes-YFP and Osx-YFP adult mice by Flow cytometry. (A) Gating of MSC (S5: Lin-CD45-CD31-Sca1+CD51+), OBC (S6: Lin-CD45-CD31-Sca1-CD51+), HPC (S2: Lin-CD45+) and EC (S3: Lin-CD45-CD31+) subpopulations in BMMNCs derived from Nes-YFP (n=30) and Osx-YFP (n=17) adult mice. (B) FACS analysis of percentage of YFP+ cell population in MSC (a, e), OBC (b, f), HPC (c, g) and EC (d, h) subsets from Nes-BMMNCs (a-d) and Osx-BMMNCs (e-h). (C) Comparison of YFP+% among MSC, OBC, HPC and EC subpopulations in Nes-BMMNCs (i) and Osx-BMMNCs (j). “*”: p<0.05, “**”: p<0.01. (D) Comparison of YFP+% in cell populations of MSC (k), OBC (l) and HPC (m) between Nes-BMMNCs and Osx-BMMNCs.