
Figure 3.
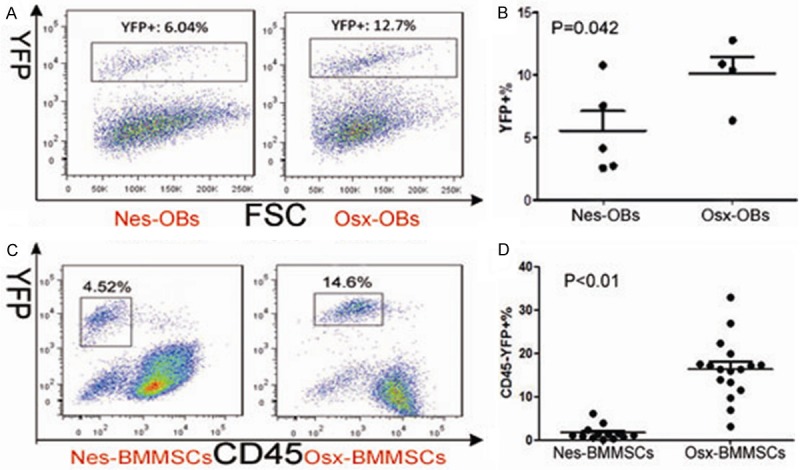
Percentage of YFP+ subpopulations in Nes/Osx-OBs and YFP+CD45-% in Nes/Osx-BMMSCs. (A) Gating of YFP+ cell population in Nes-OBs and Osx-OBs and (B) comparison of YFP+% between them. (C) Gating of CD45-YFP+ cell population in Nes-BMMSCs and Osx-BMMSCs and (D) comparison of CD45-YFP+% between them.