
Figure 4.
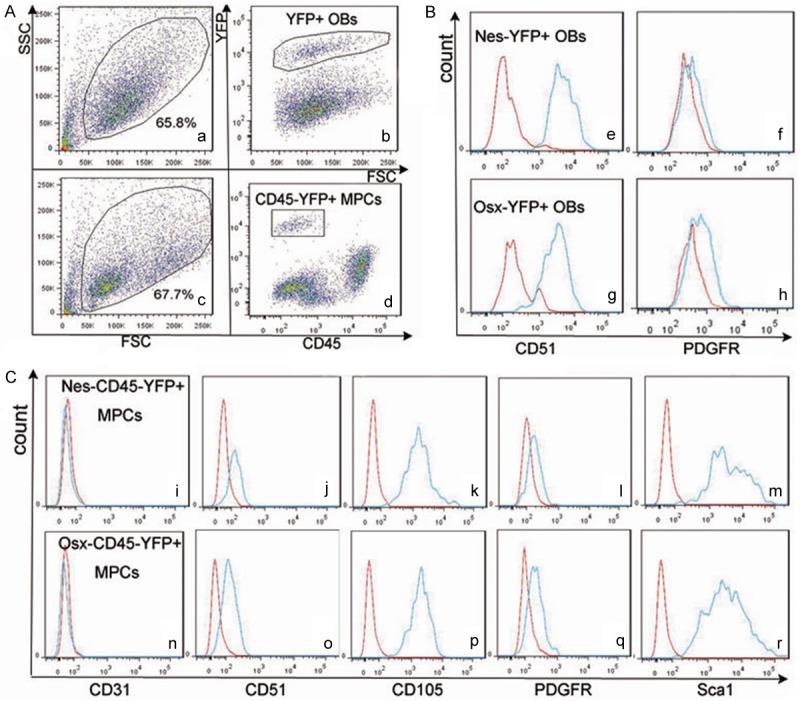
Expression of cell surface antigens in Nes/Osx-YFP+ OBs and Nes/ Osx-CD45-YFP+ MPCs. (A) Gating of YFP+ subpopulation (b) in primary OBs (a) and CD45-YFP+ subpopulation (d) in BMMSCs (c). (B) Expression of CD51 (e, g) and PDGFR (f, h) in Nes-YFP+ OBs (e, f) and Osx-YFP+ OBs (g, h); expression of CD31 (i, n), CD51 (j, o), CD105 (k, p), PDGFR (l, q) and Sca1 (m, r) in Nes-CD45-YFP+ MPCs (i-m) and Osx-CD45-YFP+ MPCs (n-r).