
Figure 5.
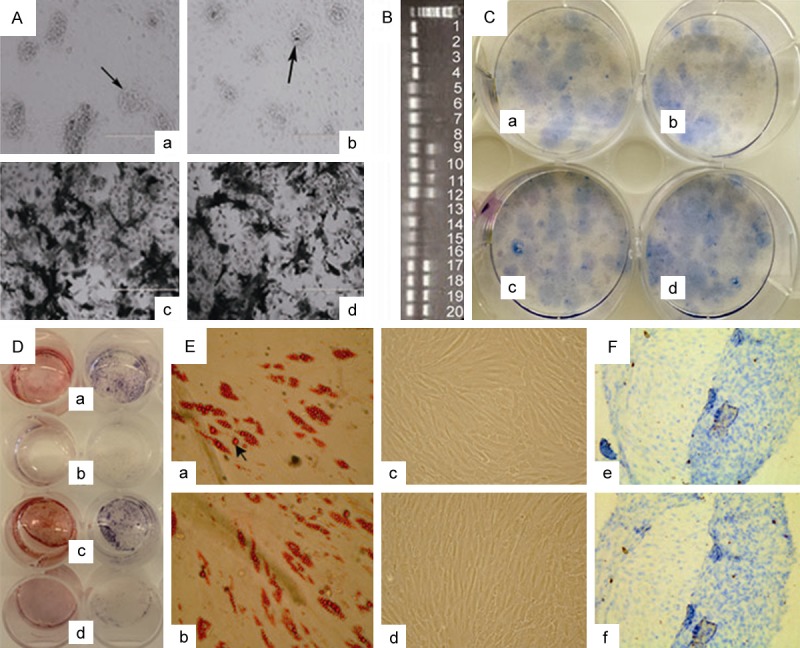
Maturation of Nes/Osx-YFP+ OBs, CFU and multi-lineage differentiation of Nes/Osx-CD45-YFP+ MPCs. (A) Formation of calcium nodules (a, b) and ALP staining (c, d) in Nes-YFP+ OBs (a, c) and Osx-YFP+ OBs (b, d). Black arrow: calcium nodules. (B) RT-PCR result of actin (NO. 1-4), OPN (NO. 5-12) and Cllagen I (NO. 13-20) expression in Nes-YFP+ OBs (N) and Osx-YFP+ OBs (O) before (d0) and after 12 days (d12) of osteoblast differentiation. (NO. 1: N-d0, 2: O-d0, 3: N-d12, 4: O-d12, 5-6: N-d0, 7-8: O-d0, 9-10: N-d12, 11-12: O-d12, 13-14: N-d0, 15-16: O-d0, 17-18: N-d12, 19-20: O-d12). (C) CFU frequency of Nes-CD45-YFP+ MPCs (a, b) and Osx-CD45-YFP+ MPCs (c, d). (D) Alizarin Red staining (left 4 wells of a-d) and ALP staining (right 4 wells of a-d) of osteogenic differentiation groups (a, c) and control groups (b, d) in Nes-CD45-YFP+ MPCs (a, b) and Osx-CD45-YFP+ MPCs (c, d). (E) Oil Red O staining of adipogenic differentiation groups (a, b) and control groups (c, d) in Nes-CD45-YFP+ MPCs (a, c) and Osx-CD45-YFP+ MPCs (b, d). Black arrow: lipid droplets. (F) Toluidine blue staining of chondrogenic differentiation in Nes-CD45-YFP+ MPCs (e) and Osx-CD45-YFP+ MPCs (f).