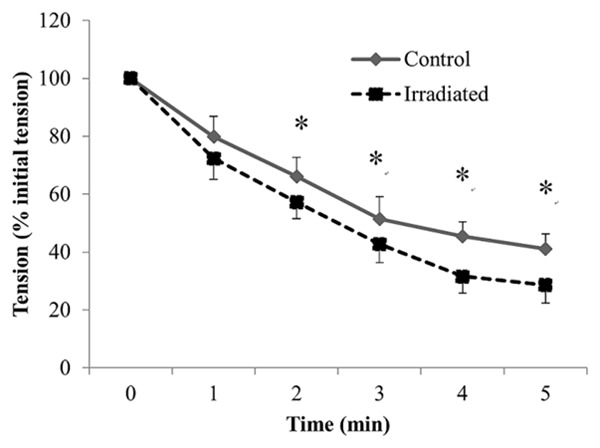
Figure 5.

Mean changes in peak tetanic tension during repetitive stimulation of diaphragmatic stripes in the control (-♦-) and irradiated (--■--) groups. Peak tetanic tension is plotted as a percentage of the initial tetanic tension, and time is from the onset of stimulation. Values are mean ± SE. *Indicates significant difference between the two groups (p < 0.05).
