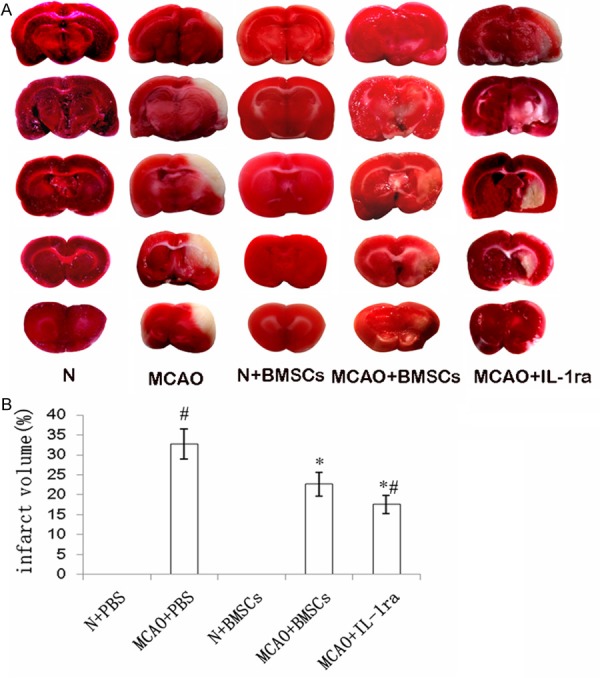
Figure 1.

Effects of BMSCs transplantation on infarct volume. A. The infarct areas were visualized by TTC staining. Representative coronal sections indicate the following groups: N + PBS, MCAO + PBS, N + BMSCs, MCAO + BMSCs, and MCAO + IL-1ra groups. No infarction areas were observed and all the brain tissues were stained red in the N + PBS and N + BMSCs groups. The infarction areas were stained white and observed in the MCAO + PBS, N + BMSCs, MCAO + BMSCs, and MCAO + IL-1ra groups. B. The bar chart showed the percentage of infarct volume of different groups. Error bars show standard deviation, *P < 0.01 versus the MCAO + PBS group, #P < 0.01 versus the MCAO + BMSCs group.
