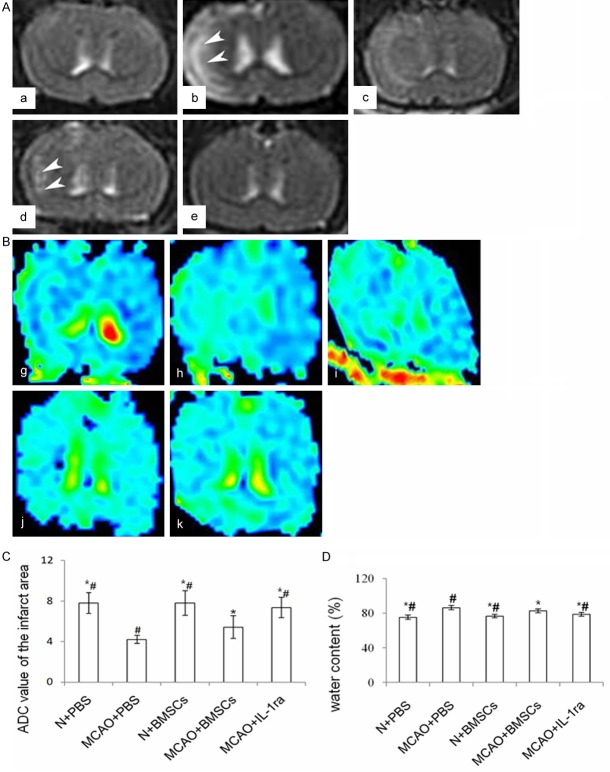
Figure 3.
Effects of BMSC transplantation on infarct volume, edema and its relationship with IL-1β protein. A. Effects of BMSC transplantation on infarct volume on T2WI of MRI. a-e indicate the MRI-T2WI of the N + PBS, MCAO + PBS, N + BMSCs, MCAO + BMSCs, and MCAO + IL-1ra groups respectively. White arrows show the abnormal signals in the injured brains of all groups. B. Effects of BMSC transplantation on infarction volumes in DWI of MRI. g-k indicate ADC images of the N + PBS, MCAO + PBS, N + BMSCs, and MCAO + BMSCs, MCAO + IL-1ra groups respectively. C. Bar chart of ADC values of the infarct area in each group. D. Effects of BMSC transplantation on brain water content in each group. Error bars show standard deviation, * indicates P < 0.05 vs. the MCAO + PBS group, # indicates P < 0.05 vs. the MCAO + BMSCs group.

