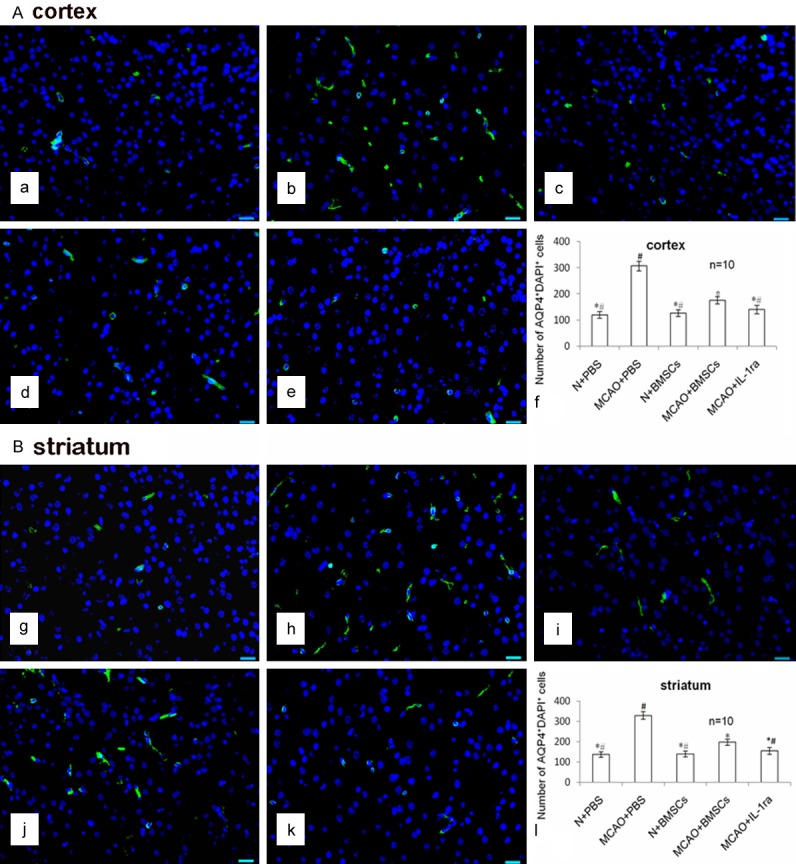
Figure 4.

Effects of BMSC transplantation on AQP4 protein in the cortex and striatum. A. AQP4/DAPI immunofluorescence staining in the cortex. The AQP4+DAPI+ cells were stained green in the cytoplasm and blue in the nucleus (white arrows). The scale bar is 20 μm and is labeled in each figure. a-e indicate AQP4/DAPI immunofluorescence staining of the N + PBS, MCAO + PBS, N + BMSCs, MCAO + BMSCs, and MCAO + IL-1ra groups in the cortex. The scale bar is 20 μm and is labeled in each figure. f indicates the bar chart of the number of AQP4+DAPI+ cells in the cortex. Error bars show standard deviation, * indicates P < 0.05 vs. the MCAO + PBS group, # indicates P < 0.05 vs. the MCAO + BMSCs group. B. AQP4/DAPI immunofluorescence staining in the striatum. g-k indicate the AQP4/DAPI staining of the N + PBS, MCAO + PBS, N + BMSCs, MCAO + BMSCs, and MCAO + IL-1ra groups in the striatum. The scale bar is 20 μm and is labeled in each figure. l indicates the bar chart of the number of AQP4+DAPI+ cells in the striatum. Error bars show standard deviation, * indicates P < 0.05 vs. the MCAO + PBS group, # indicates P < 0.05 vs. the MCAO + BMSCs group.
