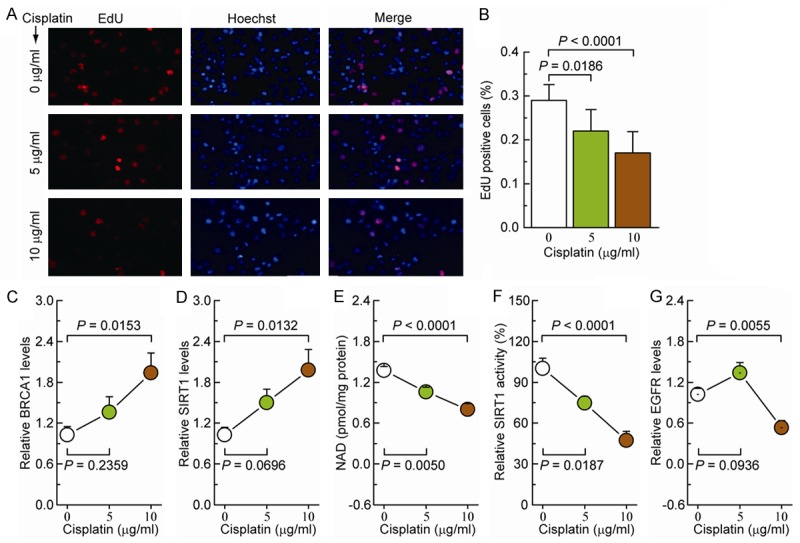
Figure 2.

Effects of cisplatin on BRCA1, SIRT1, and EGFR levels and NAD-dependent SIRT1 activity in ovarian cancer cells. A. EdU labeling showing the proliferation of A2780 cells after 5 or 10 μg/ml cisplatin treatment for 48 h. Red: EdU labeling of nuclei of proliferative cells; Blue: Hoechst 33342 labeling of cell nuclei. B. The EdU incorporation rate was expressed as the ratio of EdU-positive cells to total Hoechst 33342-positive cells. C-G. BRCA1 levels, SIRT1 levels, NAD levels, SIRT1 activity, and EGFR levels in A2780 cells after incubation with 5 or 10 μg/ml cisplatin (repeated six times). Bar graphs show mean ± SD.
