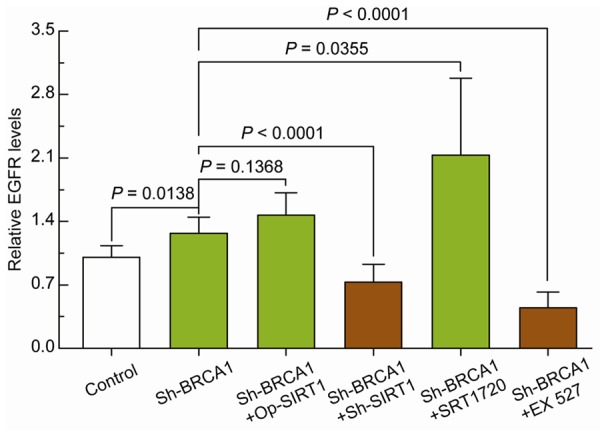
Figure 3.

Effects of BRCA1 and/or SIRT1 on EGFR expression in ovarian cancer cells. Relative EGFR mRNA levels in A2780 cells before and after BRCA1 knockdown or BRCA1 knockdown together with SIRT1 overexpression, SIRT1 knockdown, SIRT1 activity enhancement by SRT1720, or SIRT1 activity inhibition by EX 527. Bar graphs show mean ± SD. Sh: short hairpin RNAs; Op: overexpression.
