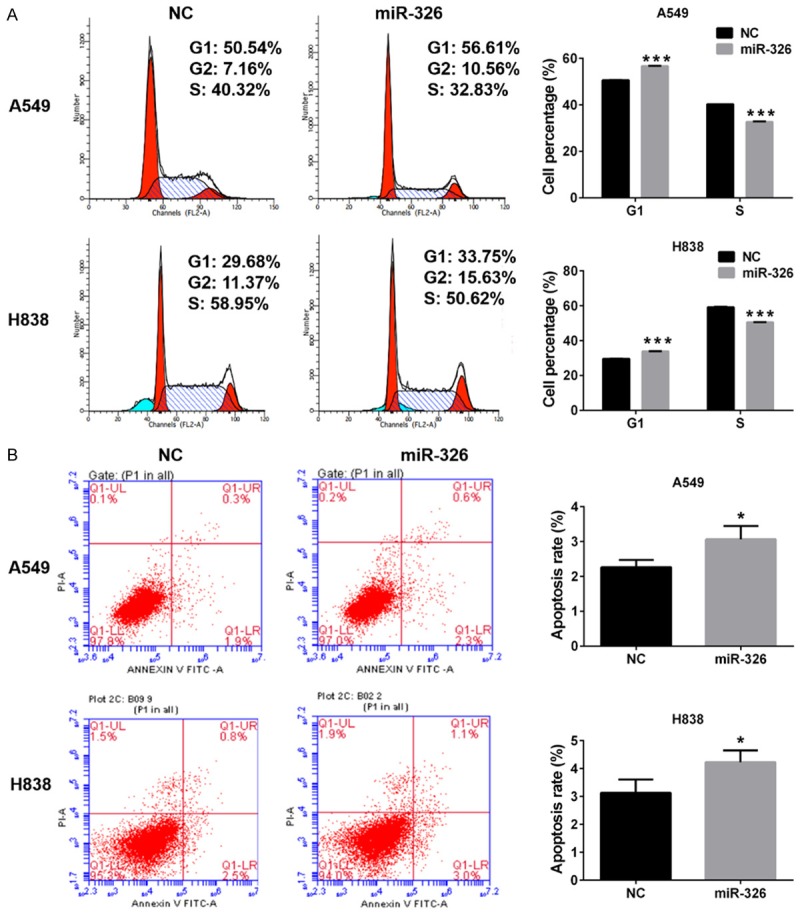
Figure 3.

Effects of miR-326 on cell cycle and apoptosis. A. Cell cycle analysis of A549 and H838 cells. B. Cell distribution of A549 and H838 cells transfected with miR-326 or NC. Column, means; bar, SD. **P<0.01 vs NC. C. Cell apoptosis analysis of A549 and H838 cells transfected with miR-326 or NC. D. Apoptosis rate of A549 and H838 cells. Column, means; bar, SD. **P<0.01 vs NC.
