
Figure 2.
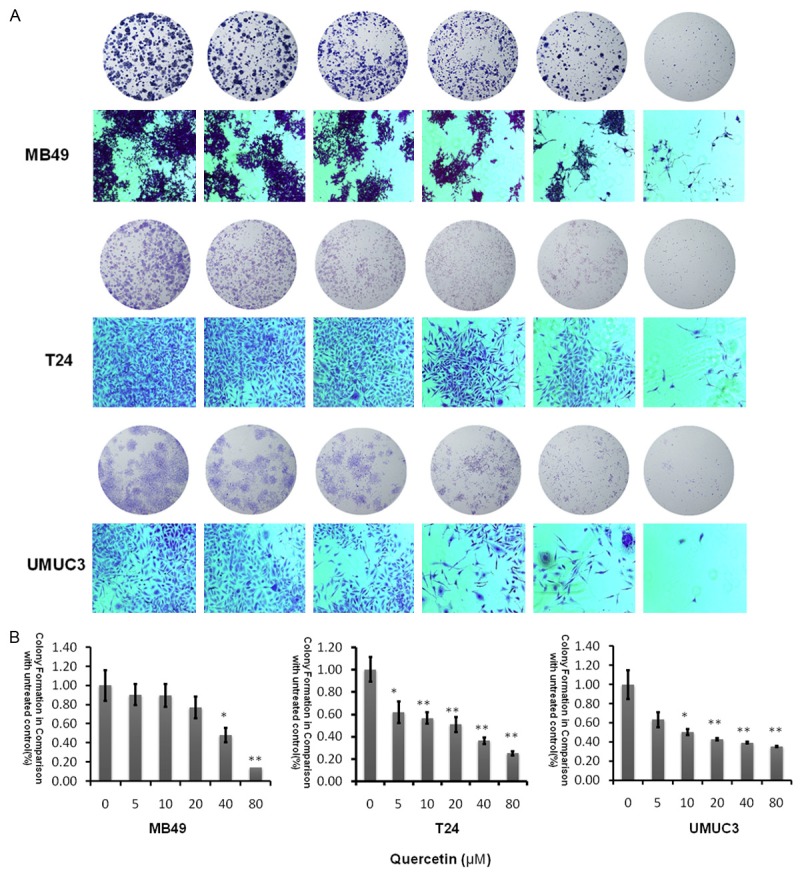
Evaluation of colony suppression of quercetin on bladder cancer cell lines. A. Clonogenic assay was assessed after 7 day quercetin treatment at various concentrations (0-80 µM) and pictures of migration on an inverted microscope with ×10 magnification. B. Bar chart shows quantitative data of average of 3 independent experiments (*P<0.05, **P<0.01 compared with control). Quantitative data were determined by solubilization of crystal violet and spectrophotometric reading at O D 550 nm. Results are presented as the median of 3 independent experiments (Comparison was drawn by the t-test (two-tailed). Data represent means ± SD; *P<0.05).