FIG 2.
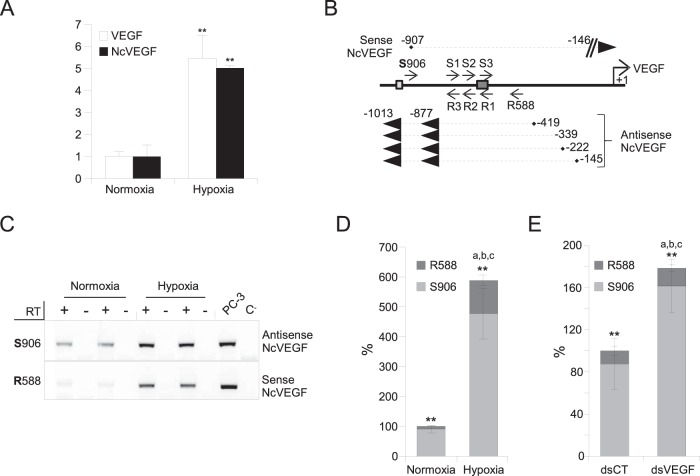
The VEGF promoter region encodes both sense and antisense NcVEGF transcripts. PC-3 cells were exposed to either normoxia or hypoxia for 18 h. (A) cDNAs were used to perform qPCR, and the results are shown as means ± the SD of three independent experiments, with each sample run in quadruplicate. 36B4 was used to normalize qPCR experiments. **, P ≤ 0.005. (B) Schema of the experimental design and results of 3′ and 5′ RACE PCRs. Briefly, a set of sense primers (S1, S2, and S3) as close as possible to the dsVEGF706 target region was used to identify either the 5′ end of antisense NcVEGF in a 5′ RACE reaction or the 3′ end of sense NcVEGF in a 3′ RACE reaction (Table 2). In parallel, a set of antisense primers (R1, R2, and R3) was used to identify either the 3′ end of antisense NcVEGF or the 5′ end of sense NcVEGF (Table 2). Both sense and antisense NcVEGFs and their positions relative to the VEGF transcription start site obtained after 3′ and 5′ RACE PCR are indicated. Dark and light boxes show the positions of the dsVEGF706 target site and HIF-responsive element (HRE), respectively. (C) Representative gene-specific (R588 or S906) RT-PCR using RNAs from PC-3 cells exposed to either normoxia or hypoxia for 18 h. The respective expressions of the sense (R588) or antisense (S906) NcVEGF transcripts were measured with NcVEGF primers (S788; R588 or S788; R706 [not shown]) (Table 2). PCR performed without cDNA (C−) or with genomic DNA from PC-3 cells (PC3) were used as a negative and positive controls, respectively. (D) Strand-specific cDNAs from three independent experiments with each sample in quadruplicate were also used in a qPCR. The results are presented as a histogram depicting the relative abundance of the antisense (S906) and sense (R588) NcVEGF in normoxia or hypoxia quantified by qPCR. ** indicates P ≤ 0.005 for sense versus antisense NcVEGF in either normoxia or hypoxia. a, b, and c all correspond to P ≤ 0.005 for sense (a), antisense (b), and sense plus antisense (c) NcVEGFs in normoxia versus hypoxia. (E) PC-3 cells were exposed to either dsCT or dsVEGF706 for 72 h. A histogram depicts the relative abundance, in both dsCT- and dsVEGF706-transfected cells, of the antisense (S906) and sense (R588) NcVEGF quantified using qPCR. ** indicates P ≤ 0.005 for sense versus antisense NcVEGF in either dsCT- or dsVEGF706-transfected cells. a corresponds to P ≤ 0.05 and b and c both indicate P ≤ 0.005 for sense (a), for antisense (b), and for sense plus antisense (c) NcVEGF in dsCT- versus dsVEGF706-transfected cells. The results are means ± the SD of three independent experiments with each sample run in quadruplicate.

