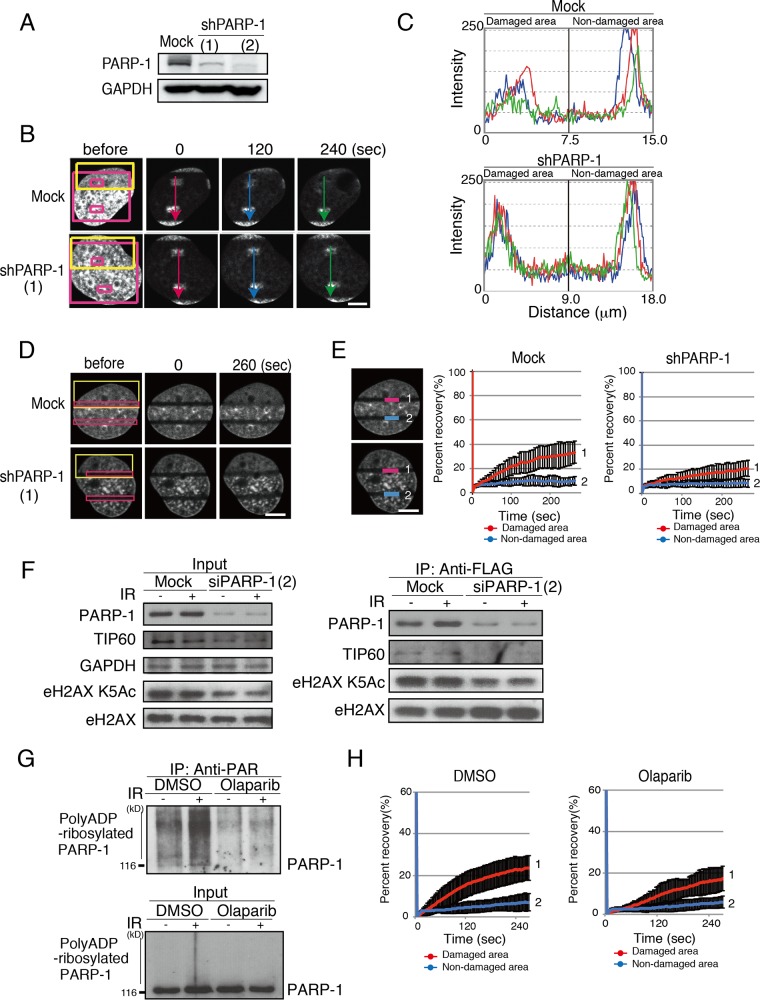
FIG 2.
PARP-1 is required for rapid exchange of H2AX at DNA damage sites. (A) Confirmation of the knockdown of PARP-1 by two different shRNAs (1 and 2). Immunoblots with anti-PARP-1 and anti-GAPDH are shown. (B) iFRAP analysis to monitor the eviction of H2AX from DNA damage sites. GM0637 cells were microirradiated (yellow box) and then photobleached (red box; excluding small boxes inside) as previously described (9). Either mock shRNA- or shPARP-1-expressing cells were subjected to the analysis. The diffusion of the unbleached signal in the small red boxes was quantified. (C) Quantification of the remaining signals shown in panel B. Fluorescent intensities were plotted. (D) FRAP analysis to monitor the incorporation of H2AX at damage sites. GM0637 cells first were microirradiated (yellow boxes) and then photobleached (red boxes). (E) The fluorescence recovery of the cells in panel D was monitored as previously described (9). (Left) The fluorescence recovery in the bleached area (for the damaged area, line 1; for the nondamaged area, line 2) was quantified. (Right) The quantification of the fluorescence recovery was plotted. Line 1 represents fluorescence recovery at the damaged area. Mock shRNA (left), fluorescence recovery of 33.3% ± 9.1% (n = 11); shTIP60 (right), 20.9% ± 6.7% (n = 11), with a P value of 0.0016 between mock shRNA and shPARP-1. Line 2 represents fluorescence recovery at the nondamaged area. In shTIP60 cells, fluorescence recovery was 8.6% ± 3.4% (n = 11); in mock shRNA, it was 9.8% ± 3.7% (n = 11). (F) eH2AX complexes were purified from mock- or siPARP-1-expressing cells before and after gamma IR (12 Gy). Immunoblot analyses using anti-PARP-1, anti-TIP60, anti-H2AX K5 acetylation (Ac), and anti-H2AX were performed. (G) Confirmation of inhibition of poly(ADP-ribosyl)ation of PARP-1 by olaparib. Immunoprecipitation (IP) with an anti-PAR antibody was performed with nuclear extracts of GM0637 cells treated with 10 μM olaparib for 24 h. An anti-PARP-1 immunoblot is shown. DMSO, dimethyl sulfoxide. (H) The inhibition of H2AX dynamics by olaparib was monitored by a FRAP analysis after microirradiation. The fluorescence recovery was quantified and plotted. Line 1 represents fluorescence recovery at the damaged area, namely, 23.6% ± 6.0% (no olaparib, n = 10) and 17.2% ± 5.9% (with olaparib, n = 10; P value of 0.0038 for comparisons with and without olaparib), and line 2 represents that at the nondamaged area, namely, 7.0% ± 4.2% (no olaparib, n = 10) and 5.9% ± 2.9% (with olaparib, n = 10; P value of 0.34 for comparisons with and without olaparib). Standard deviations are shown. Bars, 10 μm.

