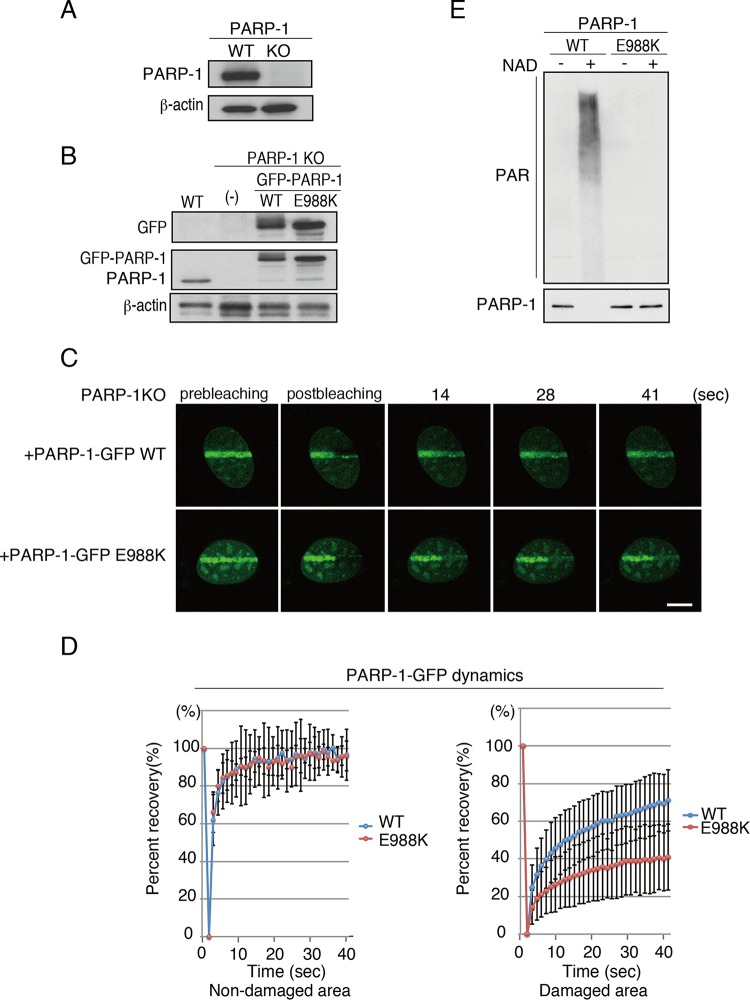
FIG 4.
FRAP analysis using GFP–PARP-1. (A) Immunoblot analysis to confirm PARP-1 KO cells. (B) Reconstitution of either GFP-tagged PARP-1 WT or PARP-1 with the E988K mutation (E988K) was subjected to immunoblot analyses using anti-GFP, anti-PARP-1, and anti-beta-actin antibodies. (C) FRAP analysis to monitor the dynamics of PARP-1–GFP. The PARP-1–GFP WT or that with the E988K mutation accumulated at the microirradiated area was photobleached. Bar, 10 μm. (D) The fluorescence recovery of the GFP signal of PARP-1–GFP WT or E988K was quantified and plotted. (Left) Nonmicroirradiated (nondamaged) area. WT, 96.6% ± 13.6% (n = 10); E988K, 96.0% ± 7.9% (n = 13). (Right) Microirradiated area (damaged area). WT, 71.1% ± 16.3% (n = 12); E988K, 41.0% ± 17.6% (n = 11). Standard deviations are shown. (E) In vitro analysis of auto-poly(ADP-ribosyl)ation activity of PARP-1. Immunoblot analyses using anti-poly(ADP-ribosyl)ation antibody (top) and anti-PARP-1 antibody (bottom) are shown.

