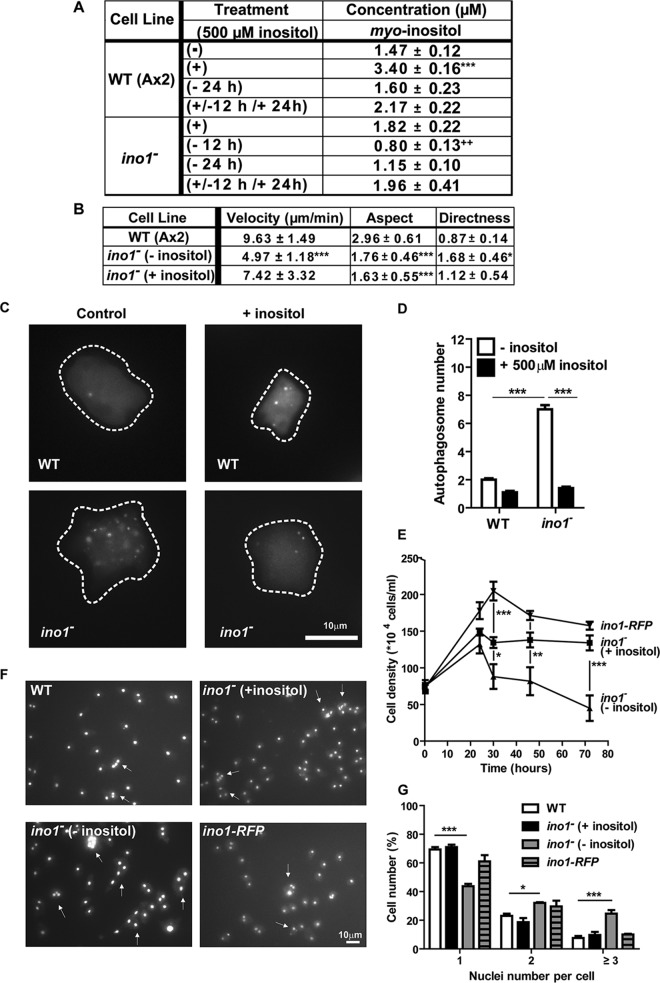
FIG 3.
Inositol depletion causes a change in velocity and cell shape, an activation of autophagy, a loss in cell-substrate adhesion, and a reduction in cytokinesis in Dictyostelium ino1− cells. (A) Levels of myo-inositol, as analyzed by NMR spectroscopy, in wild-type and ino1− cells grown with (+; 500 μM) or without (−) exogenous inositol for 12 or 24 h or following inositol reintroduction (+/−). Data shown are means ± SEM. Inositol levels were reduced in the ino1− mutant following inositol depletion for 12 and 24 h and were restored to basal levels following reintroduction for 12 h. (B) Average velocity, aspect, and persistence of aggregation-competent ino1− cells (grown with [+] or without [−] 500 μM inositol for 24 h prior to imaging) or wild-type cells during chemotaxis toward cAMP. Velocity shows the distance traveled by cells over time. Aspect refers to the roundness of cells (1 = perfectly round). Directness is a ratio of the distance traveled by a cell to the total direct distance, where 1 represents a straight line. (C and D) Autophagosomes were visualized in wild-type and ino1− cells expressing Atg8-GFP (C) and quantified in the absence of inositol (24 h) (control) or presence of inositol (D). (E) Cell adhesion was monitored in wild-type and ino1− cells and in ino1− cells expressing ino1-RFP in the presence (500 μM) or absence of inositol for at least 24 h. (F and G) Cytokinesis was examined in wild-type and ino1− cells and in ino1− cells expressing ino1-RFP by using the DAPI nuclear stain to label cell nuclei (F), and the number of nuclei per cell was quantified (G). For panels A, B, D, and E, statistical significance was determined by the unpaired two-tailed t test, with each condition compared separately to wild-type cells (− inositol) (A, B, and D) and ino1− cells (+ inositol) (D). For panels E and G, statistical significance was determined by 2-way ANOVA with the Bonferroni posttest. *, P < 0.05; **, P < 0.01; ***, P < 0.001. Error bars represent SEM. For panel A, there were 4 experimental repeats. For panel B, ≥20 cells were analyzed per condition in 3 experimental repeats. For panel D, 117 cells were analyzed per condition in 3 experimental repeats. For panel E, there were 3 experimental repeats. For panel G, 386 cells were analyzed per condition in 3 experimental repeats.

