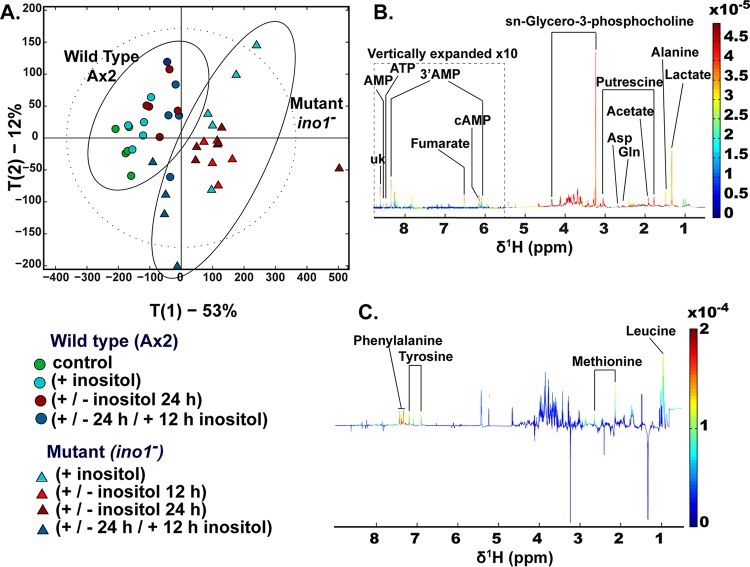
FIG 5.
Comparison of metabolic profiles of Dictyostelium following Ino1 loss and inositol depletion. To monitor metabolic profiles in the wild type and the ino1− mutant, cells were grown in the presence of inositol (500 μM; +), with inositol followed by inositol withdrawal (12 or 24 h; +/−), or with inositol added after a 24-h depletion period (500 μM for 12 h; +/−/+). The controls were cells without inositol supplementation. (A) Distribution of metabolic variations between cell type and myo-inositol exposure were assessed by principal component analysis (PCA) of data generated from the 1H-NMR spectra of the Dictyostelium metabolic fingerprints. The main source of variation (53%) was driven by the mutation, while inositol depletion accounted for approximately 12% of the metabolic variation in this data set. (B) Loading plot associated with PC1 (red peaks pointing upwards are positively associated with PC1, while those pointing downwards are negatively associated with PC1). (C) Loading plot associated with PC2. A total of 5 experimental repeats were performed.

