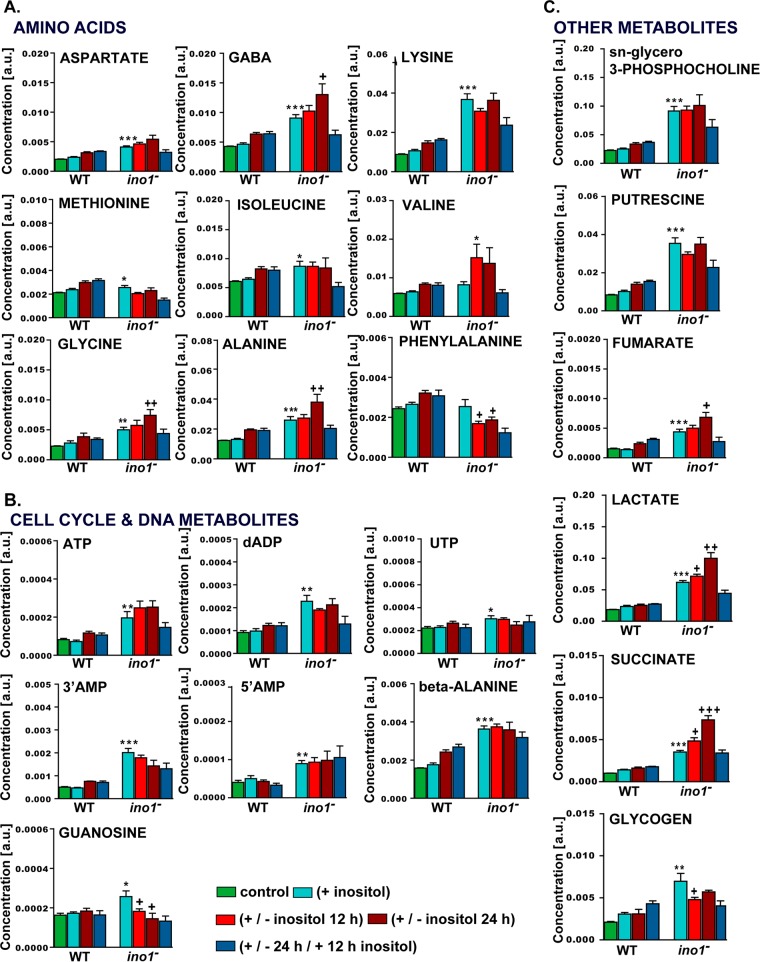
FIG 7.
Levels of metabolites in wild-type and ino1− cells grown under various inositol conditions. Metabolite levels measured by NMR spectroscopy were quantified using MATLAB and plotted to illustrate changes observed in wild-type and ino1− cells for amino acids (A), cell cycle- and DNA-related metabolites (B), and other metabolites (C). The controls were cells without inositol supplementation. Statistical analysis was carried out for wild-type (AX2) (+ inositol) versus ino1− (+ inositol) cells by the unpaired two-tailed t test to illustrate the significance of changes due to the loss of the Ino1 protein. *, P < 0.05; **, P < 0.01; ***, P < 0.001. A separate unpaired two-tailed t test analysis was used to compare ino1− (+ inositol) versus ino1− (− inositol 12 h) cells and ino1− (+ inositol) versus ino1− (− inositol 24 h) cells. +, P < 0.05; ++, P < 0.01; +++, P < 0.001. Error bars represent SEM for 5 experimental repeats per sample per condition. a.u., arbitrary units.

