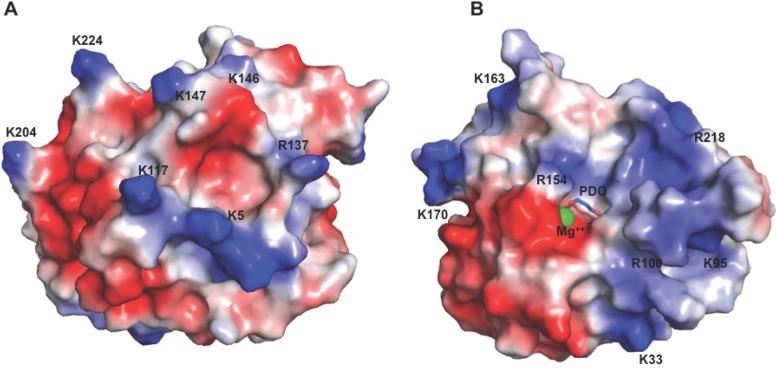
FIG 8.
Electrostatic surfaces of H3 detail locations of positive charges and of bound Mg2+. (A) View of the surface of H3, colored by surface positive charge (blue) and negative charge (red), with the darkest red signifying −75 mV and the darkest blue signifying +75 mV. (B) View after a 180° rotation from the view shown in panel A around the vertical axis. All lysines and arginines are identified and were used in the calculation, except for six for which side-chain electron density was absent. Electrostatic calculations were generated with APBS (Adaptive Poisson-Boltzmann Solver) (69).

