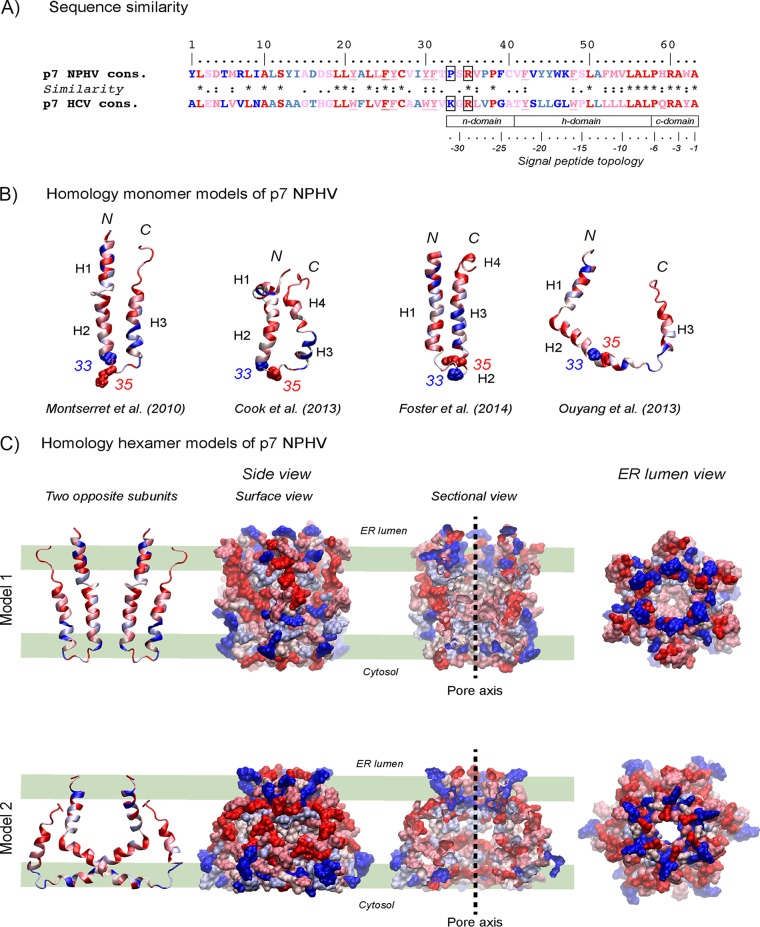
FIG 2.
Homology structure models of NPHV p7. (A) Comparison of the NPHV p7 consensus sequence (see Fig. 1) to the HCV p7 consensus sequence. The degree of amino acid physicochemical conservation at each position is inferred with the similarity index according to ClustalW conventions (asterisk, invariant, red; colon, highly similar, dark pink; dot, similar, pink). Nonconserved but slightly different residues are colored light blue, while very different residues are colored dark blue. Underlined residues correspond to positions exhibiting conserved aromatic residues. Positions 33 and 35 in the central cytosolic loop are boxed. Note that the C-terminal half of p7 exhibits structural features that are characteristic of signal peptides (62), consisting of an N-terminal region (n domain) encompassing 1 to 3 positively charged residues (Arg), a hydrophobic core region (h domain) forming an alpha-helix, and a more polar, flexible region (c domain) containing a signal peptidase cleavage site; residues at positions −1 and −3 relative to the cleavage site are small neutral residues (Ala) and form the recognition site for signal peptidases (63), whereas alpha-helix-destabilizing residues (Pro, Gly) are present at position −6 and/or in the middle of the h domain. (B) Ribbon representations of the three-dimensional homology models of NPHV p7 monomer. Four previously published NMR-based structures were used as the templates for modeling (23–26). Left, p7 monomer structure determined by NMR in 50% TFE and molecular dynamic (MD) simulations (23) (PDB 2K8J); middle left, NMR-based structure of p7 monomer determined in 125 mM DHPC (25) (PDB 2MTS); middle right, Flag-p7 monomer structure determined in 100% methanol (MeOH) (24) (PDB 3ZD0; the Flag tag and C-terminal extension are not shown); right, one subunit of hexamer p7 NMR structure model determined in 200 mM DPC (26) (PDB 2M6X). N and C termini are indicated by “N” and “C,” respectively. Alpha-helical segments are indicated, and residues are color coded as described for panel A. Residues 33 and 35 side chain atoms are represented as van der Waals spheres and illustrate the location of the central cytosolic loop of p7. (C) Three-dimensional homology models 1 and 2 of NPHV p7 hexamer using the HCV p7 NMR/MD model in POPC of Chandler et al. (19) (model 1) and the HCV p7 NMR model in DPC of Ouyang et al. (26) (model 2) as the templates. Two opposing subunits are shown on the left. Hexameric forms of NPHV p7 models are in surface representations from different viewpoints: middle left, side view of the hexamer surface; middle right, sectional view showing the pore interior with its axis symbolized by the dashed line; right, ER lumen view showing the pore. Residues are color coded as described for panels A and B. The thick green lines shown in the left-hand panels represent the polar membrane bilayer interfaces and hydrophobic core (between the middle two lines).

