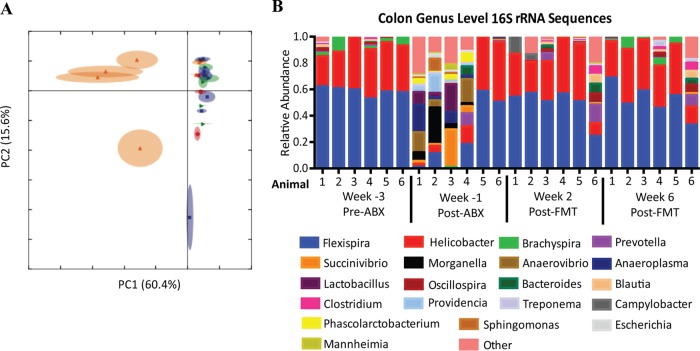
FIG 2.
ABX and FMT treatment resulted in microbiome composition changes. (A) Principal-component analysis using the relative abundances of all genera from colon biopsy specimens across all time points. Green, pre-ABX (week −3); orange, post-ABX (week −1); blue, 2 weeks post-FMT (week 2); red, 6 weeks post-FMT (week 6). (B) Relative abundance of bacterial genera from colon biopsy specimens pre- and post-ABX and post-FMT. The 20 most abundant genera are shown. Less abundant genera were grouped into the “other” category (pink).

