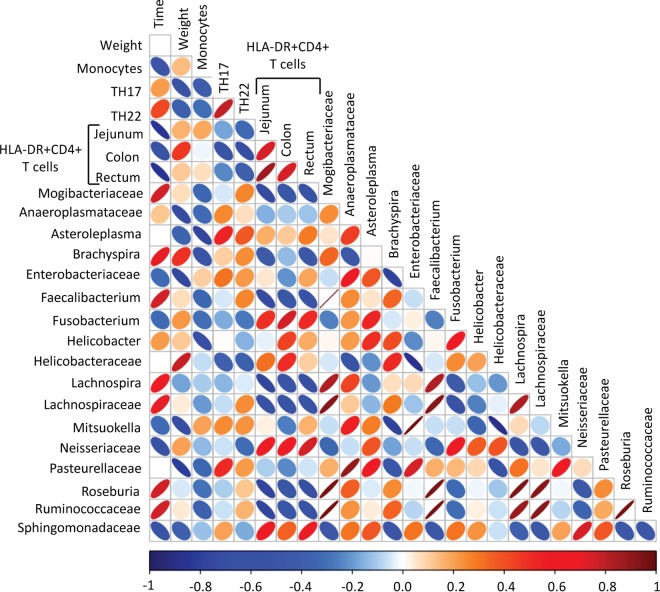
FIG 5.
Correlation matrix of taxonomic groups that most strongly correlated with immunological or physiological parameters. Colors indicate Spearman correlation coefficient values ranging from −1 (dark blue) to 1 (dark red). The ellipse shape indicates the relative spread of data points and the slope of the correlation, with a wider ellipse indicating a greater relative spread and a narrower ellipse indicating less of a spread.

