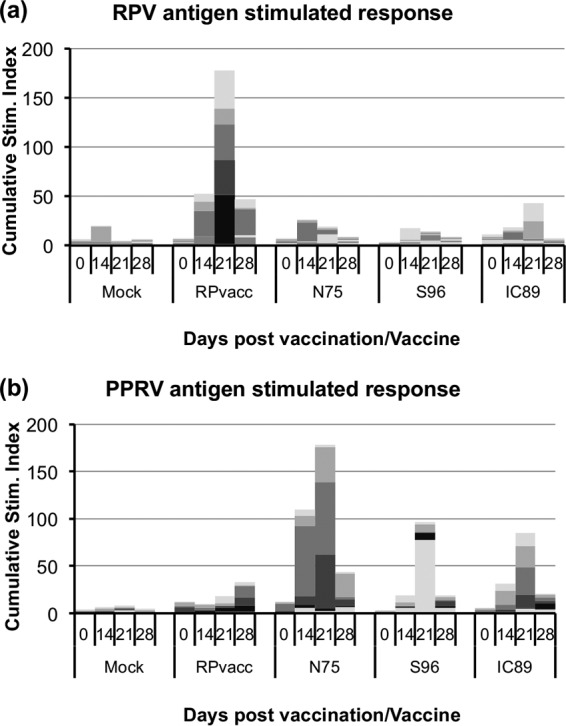
FIG 4.

Assay of T cell proliferation in PBMCs from vaccinated animals. PBMCs were isolated from cattle vaccinated as described in the legend of Fig. 3. Proliferation in response to stimulation with RPV or PPRV proteins was measured as described in Materials and Methods and plotted as the cumulative stimulation index (ratio of thymidine incorporation in response to specific antigen to incorporation in response to control antigen) for each group of animals at the indicated day postvaccination. The response in individual animals is shown by different shades of gray, which make up the cumulative response.
