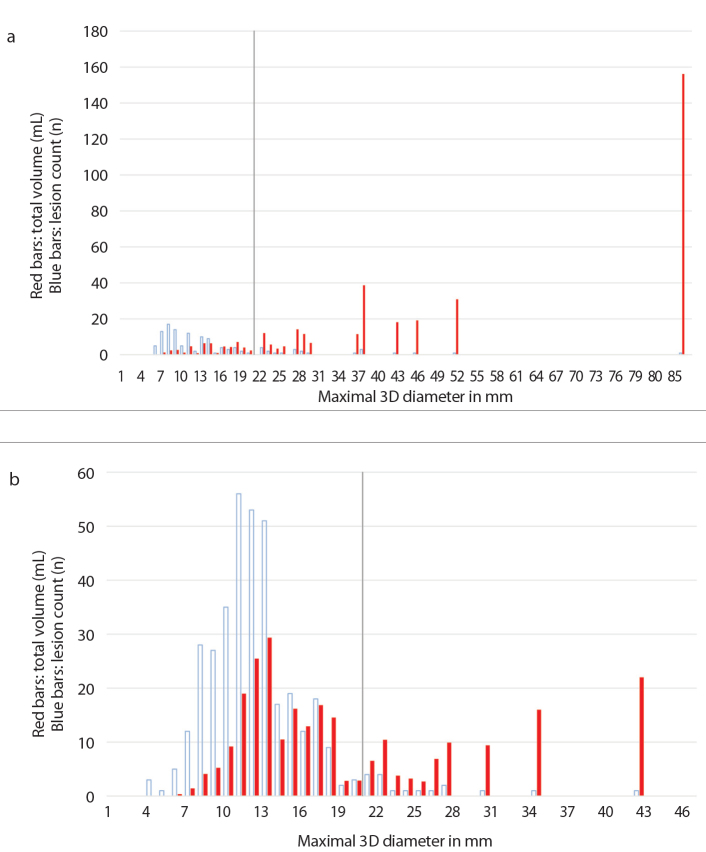
Figure 4. a, b.
Analysis of tumor load; red bars indicate the size-group’s total volume in mL, blue bars indicate the lesion count. Chart (a) shows the tumor load distribution of patient 13 with a total of 144 lesions, 102 of them ≤20 mm. Yet these lesions contribute to only 13.2% of the total tumor load. In comparison, chart (b) shows patient 7 with a total of 368 lesions, 351 of them ≤20 mm. These lesions contribute to 65.3% of the total tumor load. Note the cutoff lines at 20 mm. The total volumes of the groups are depicted in the charts as red/filled bars beginning with the smallest group to the left and the largest group to the right; e.g., in chart (b), the 10 mm group had a total added volume of 9 mL. The blue/empty bars represent the same size-groups, but depict the number of lesions that make each group up; e.g., in chart (b), the 10 mm group consists of 35 lesions.

