
Figure 1.
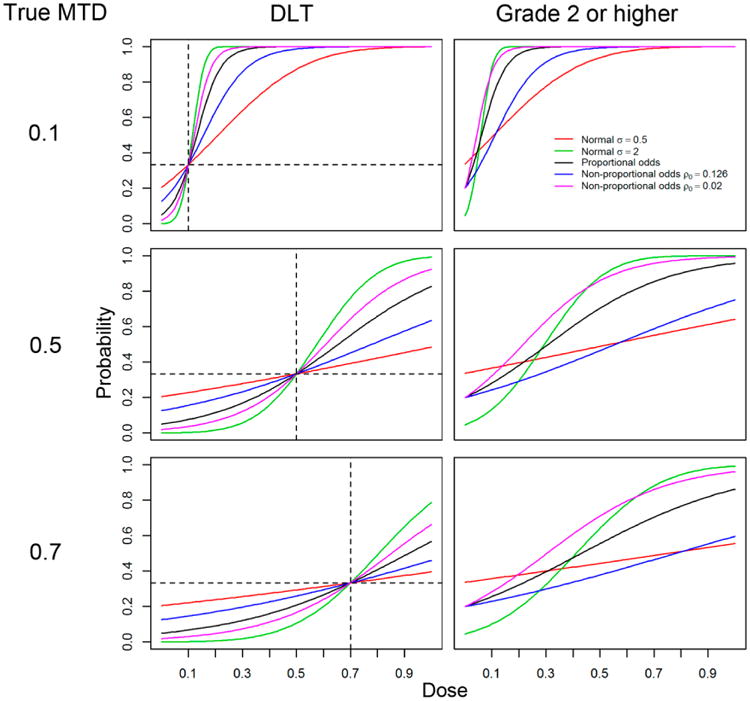
Dose-toxicity relationship for P(DLT|dose) on the left hand side and for P(grade 2 or higher|dose) on the right hand side, for three selected values of true MTD, for five models considered in the simulation studies: proportional odds logistic (black), normal with σ = 0.5 (red), normal with σ = 2 (green), non-proportional odds with ρ0 = 0.126 (blue), and non-proportional odds with ρ0 = 0.02 (magenta). The horizontal dashed lines represent the target probability of DLT θ = 0.33 and the vertical lines correspond to the true values of the MTDγ.