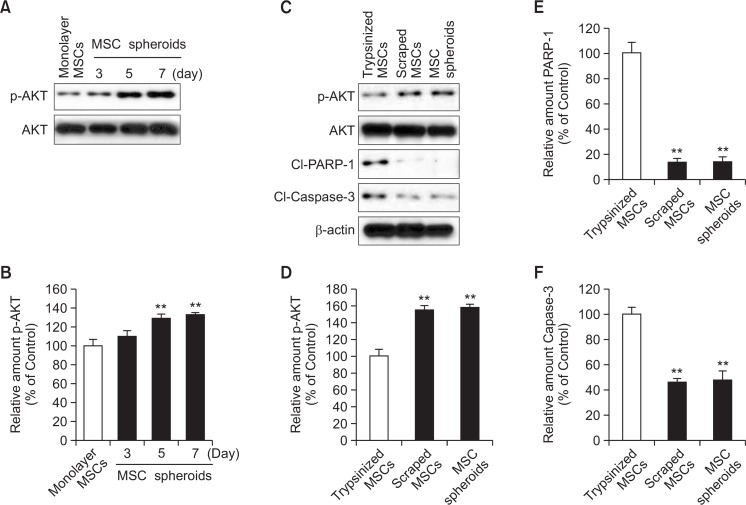
Fig. 4.
Apoptosis-associated signals in MSCs spheroids. (A) Western blot analysis for phosphorylation of AKT in monolayer MSCs and MSC spheroids cultured for 3, 5, and 7 days. (B) Relative expression of phosphorylated AKT normalized to total-AKT expression. Values represent means ± SEM. **p<0.01 vs. monolayer MSCs. (C) Western blot analysis for AKT phosphorylation and expression of cleaved PARP-1 and cleaved caspase-3 in trypsinized MSCs, scraped MSCs, and MSC spheroids cultured for 7 days. (D–F) Relative expression of phosphorylated AKT was normalized to total-AKT expression; Expression of cleaved PARP-1 and cleaved caspase-3 was normalized to that of β-actin. Values represent means ± SEM. **p<0.01 vs. trypsinized MSCs.

