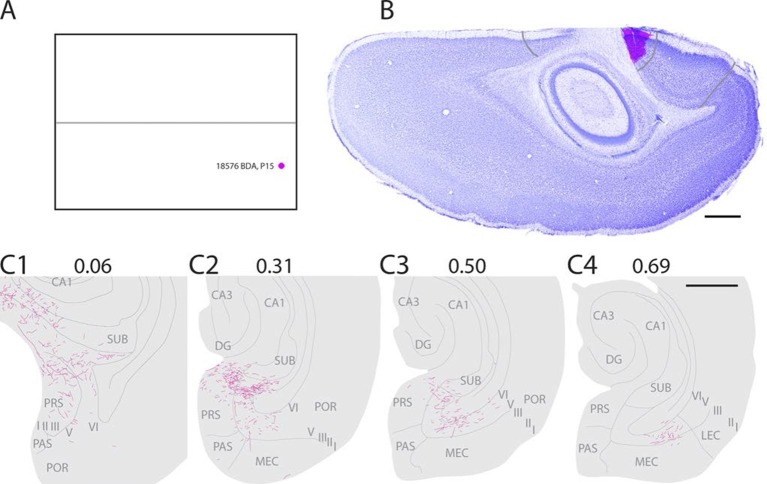
Figure 3. Representative example of an injection in caudal A29.
(A) Normalized flatmap with location of an injection in caudal A29 (magenta). (B) Horizontally cut and Nissl stained section at the level of the injection overlaid with an adjacent section containing the center of the fluorescent tracer injection in caudal A29 (magenta). Grey lines depict delineation of A29 and A30. (C) The projections after the injection were traced and represented in a dorsoventral series of drawings of horizontal sections through the PHR. Labeled fibers are located in more proximal parts of layers I, III and V-VI of PrS compared to after projections in A30 (compare C1-3 and Figure 2). At successively more ventral levels, fibers also extended into increasingly more lateral parts of layers V-VI of MEC compared with injections in A30 (compare C2-4 and Figure 2). Grey lines depict borders between the HF-PHR subdivisions, the border between cortex and white matter and lamina dissecans. Scale bars equal 1000 µm.

