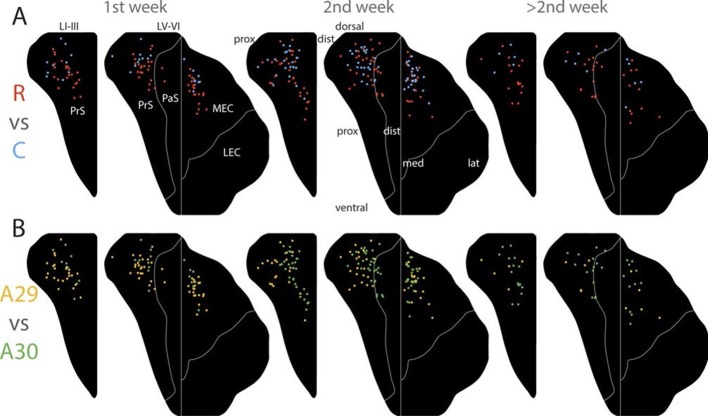
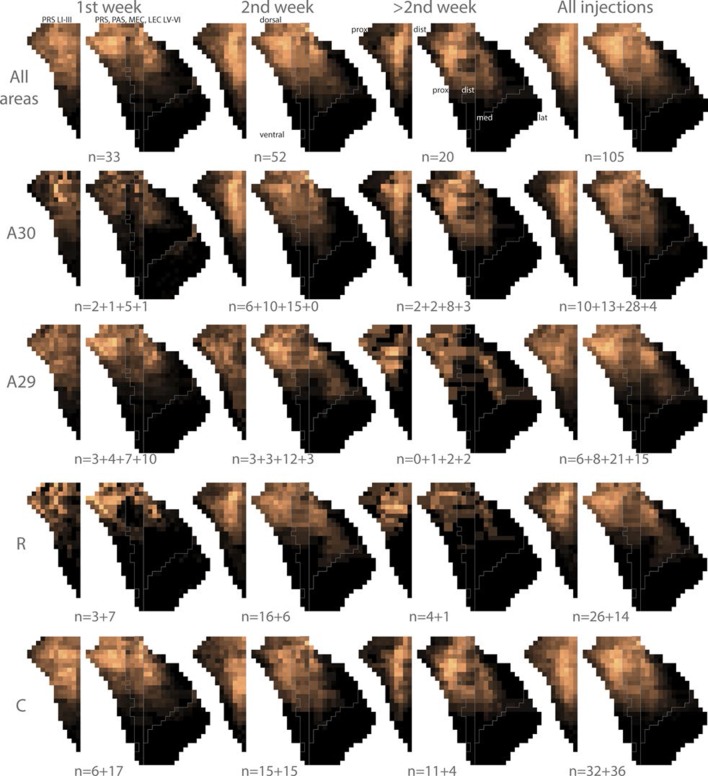
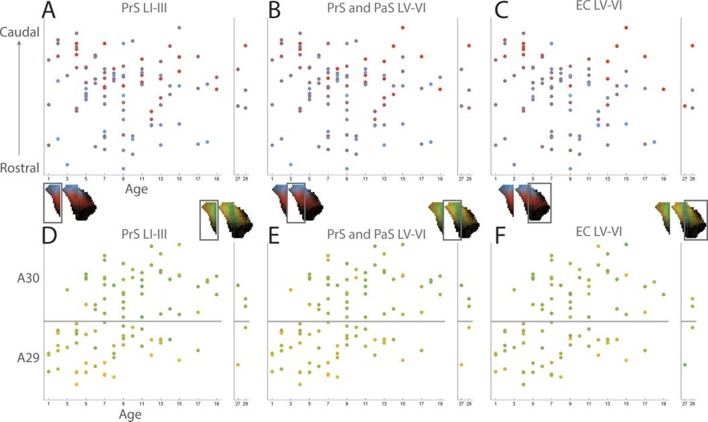
Figure 6. Development of topographies.
The position of the centers of mass of the labelling in layers I and III of PrS, layers V-VI of PrS and PaS and layers V-VI of MEC and LEC is plotted (see also Figure 6—figure supplement 2). Each dot is color coded with respect to the rostrocaudal (A) or dorsoventral position (B) of the injections in RSC (rostral half; blue, caudal half; red, A29; yellow, A30; green). Left column; animals aged P1-6, middle column; animals aged P7-13, right column; animals aged P14-28. Age is not related to the dorsoventral position of the plexus (PrS LI-III: p=0.876; PRS and PaS LV-VI; p=0.187; EC LV-VI: p=0.198) or the transverse position of the plexus (PrS LI-III: p=0.641; PrS and PaS LV-VI; p=0.325; EC LV-VI: p=0.402). Multiple regression was used for all statistical tests (Figure 5—source data 1–12). For flatmaps of the projection patterns see Figure 6—figure supplement 1.


