
Extended Data Figure 4. Evidence that variable (ratio)A values for dCas9HNH-1 reflect distinct conformational states/dynamics, and FRET data for Cas9HNH-2.
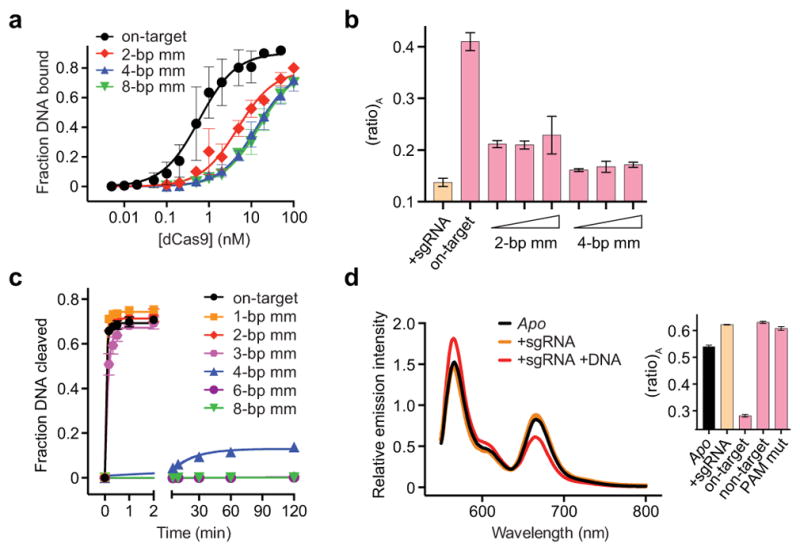
a, DNA binding assay with dCas9 and either on-target DNA or off-target DNAs containing 2, 4, or 8-bp mismatches at the PAM-distal end. Binding fits are shown as solid lines and yield equilibrium dissociation constants (Kd) of 0.80, 6.7, 19, and 20 nM, respectively. Given these values, 99%, 96%, 89%, and 89% of dCas9 should be bound to DNA under the conditions used for FRET experiments in Figure 2c (50 nM dCas9HNH-1, 200 nM DNA). b, (ratio)A data for 50 nM dCas9HNH-1 in the presence of 1 μM sgRNA and either 200 nM, 400 nM, or 1 μM off-target DNAs containing 2- or 4-bp mismatches. Data for sgRNA only and on-target DNA are shown for comparison. c, DNA cleavage time courses for the indicated DNA substrates using wild-type Cas9. Exponential fits are shown as solid lines, and extracted rate constants are shown in Figure 2d. d, Fluorescence emission spectra of Cas9HNH-2 in the presence of the indicated substrates. The inset shows (ratio)A values; mut, mutation. Error bars in a and b–d represent the standard deviation from three-to-five and three experiments, respectively.