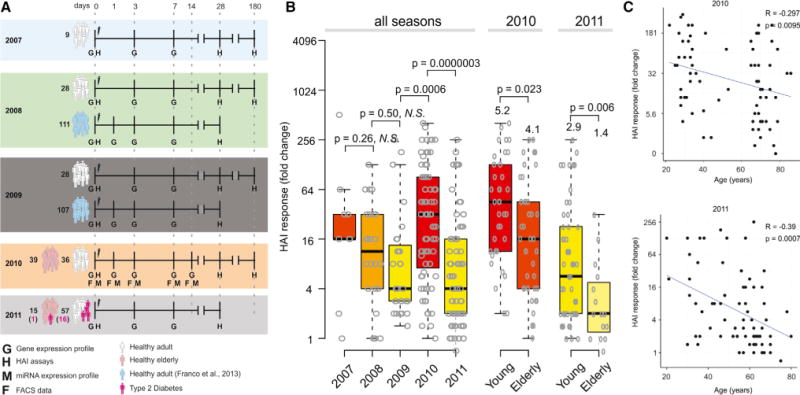
Figure 1. Experimental Approach and Humoral Immunity to Influenza Vaccination in Young and Elderly.

(A) Experimental approach used to study five consecutive influenza vaccination seasons. Microarray experiments and HAI assays were used to obtain the gene expression profiles and antibody responses of 413 TIV vaccinees. Flow cytometry and miRNA expression data were obtained for vaccinees from 2010 season. For 2008 and 2009 seasons, publicly available data (Franco et al., 2013) were included.
(B) HAI responses by season. The maximum HAI response (highest day 28-day 0 fold-induction among all three strains) is shown for all 212 subjects separated by flu season, along with box plots indicating the first and third quartiles and median. For 2010 and 2011, subjects are also separated into young (<65 years old) and elderly (65 or older). p values represent results of independent two-sample t test between responses of young and elderly.
(C) Correlation of HAI responses with age in the 2010 season and 2011 season. R and p represent the Pearson correlation coefficient and associated p value, respectively.
See also Figure S1.
