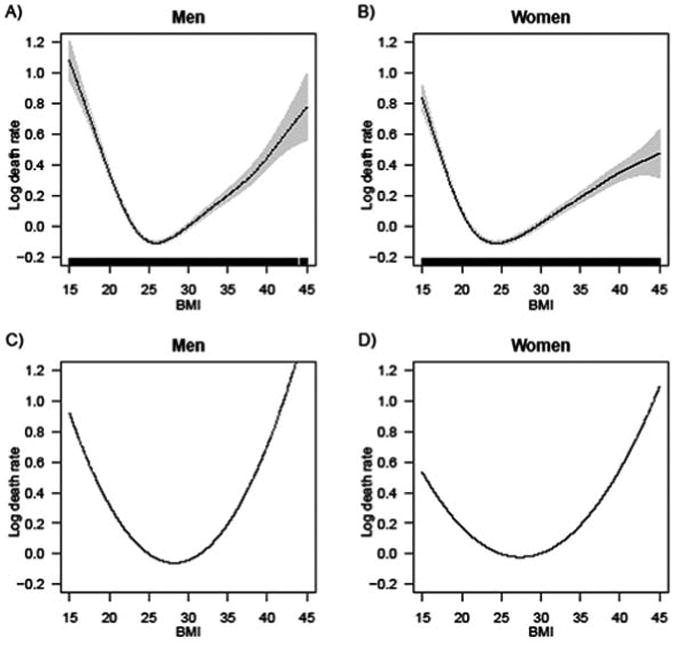
Figure 1.

Comparison of results from GAM and GLM Poisson models of all-cause mortality as a function of BMI. In the first row (Panel A for men and Panel B for women), the shape of the BMI mortality association is freely estimated from the data. In the second row (Panel C for men and Panel D for women), the functional form for BMI is specified to be quadratic, in accordance with previous literature
