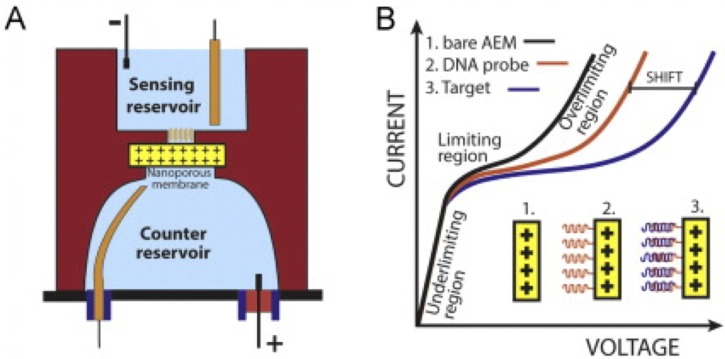
FIG. 3.
Ionic-membrane sensor. (a) Schematic showing the ionic-membrane membrane between a sensing and counter reservoirs. Capture probes are functionalized on the side of the membrane facing the sensing reservoir. (b) Schematics of the characteristic I-V curves of a membrane without any probe (AEM: anion-exchange membrane; black line), with a functionalized probe (red line), and after target hybridization with the probe (blue line). The shift of the I-V curves can be correlated to the number of target molecules present in the sample. Adapted with permission from Senapati et al., Biomicrofluidics 60, 92–100 (2014). Copyright 2014 AIP Publishing.118

