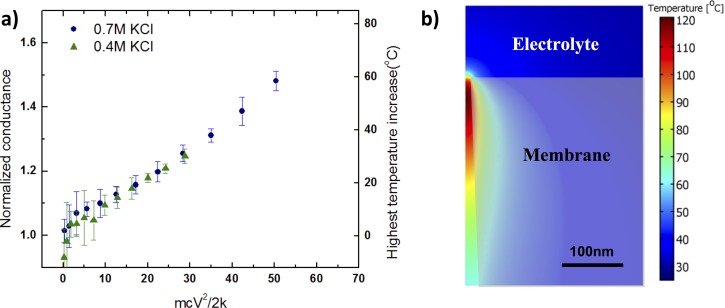
FIG. 9.
(a) Measured average conductance normalized by the zero voltage value as a function of the voltage (V) and ionic strength in molarity (M) for a single pore polymer membrane. Right vertical axis: temperature increase at corresponding normalized conductance predicted by simulation. The error bar is the standard deviation of three times of measurement. b) Numerical simulation of the nanopore temperature shows a hotspot about 100 nm in linear dimension and with a maximum temperature exceeding 85 °C.

