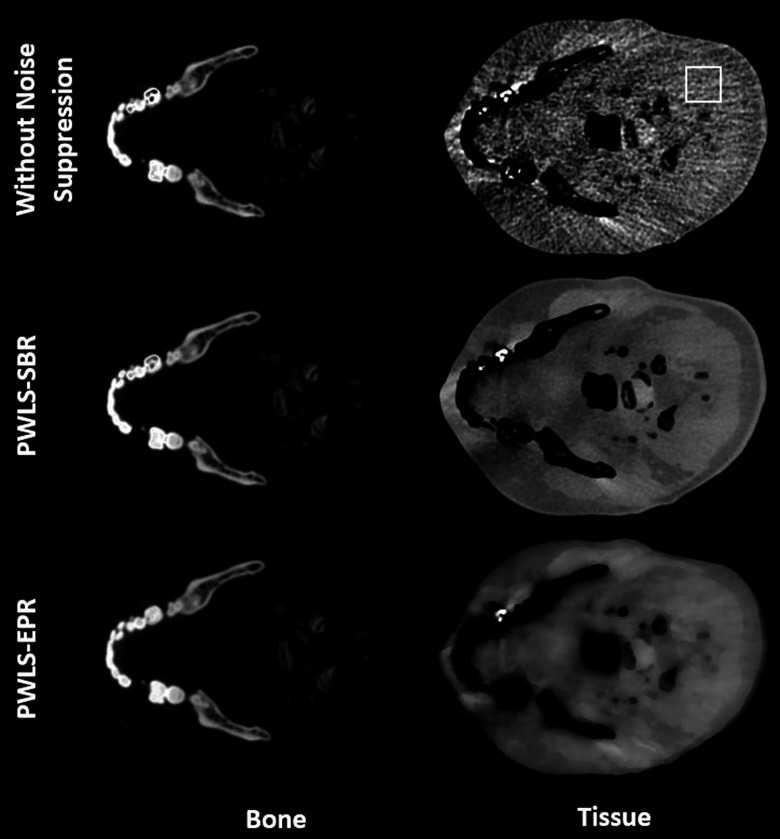
FIG. 11.
Decomposed bone and tissue images using direct matrix inversion without noise suppression, PWLS-SBR, and PWLS-EPR. The ROI used to calculate mean and STD values of Table IV is outlined on the tissue image without noise suppression. Display window: [0.1 1.2] for bone images and [0.8 1.2] for tissue images.

