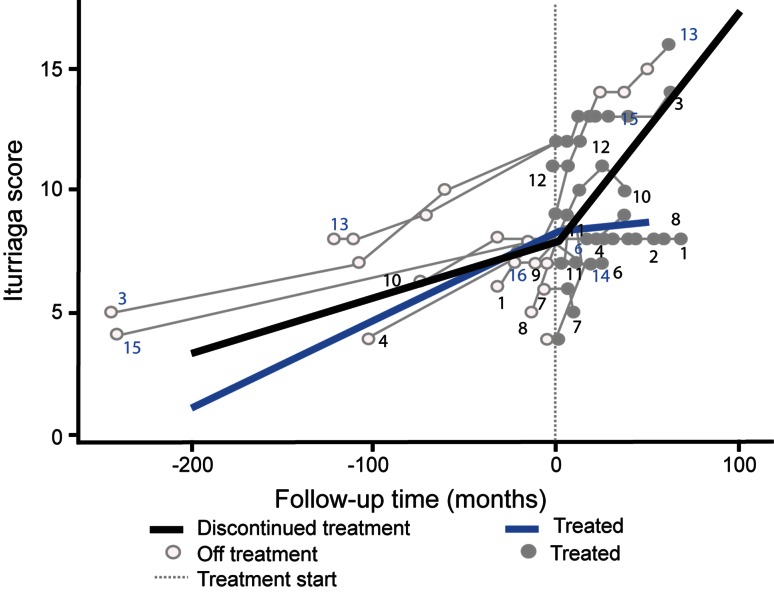
Fig. 1.
CFD score progression over time. Data based on total observation period across all patients. Zero time point on x-axis represents start of miglustat treatment; thick coloured lines represent average prediction based on linear mixed-effects analysis, and thinner grey lines represent individual patient data

