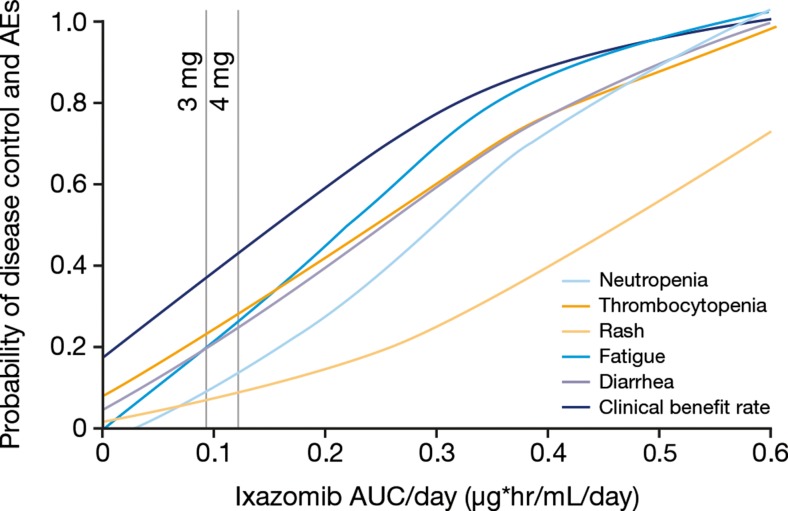
Fig. 2.
Relationships between adverse events (grade ≥ 3 for hematologic and grade ≥ 2 for non-hematologic adverse events) or clinical benefit rate (≥stable disease) with single-agent weekly ixazomib, and ixazomib exposure associated with 3 mg and 4 mg fixed doses (N = 44). AEs, adverse events; AUC, area under the plasma concentration–time curve

