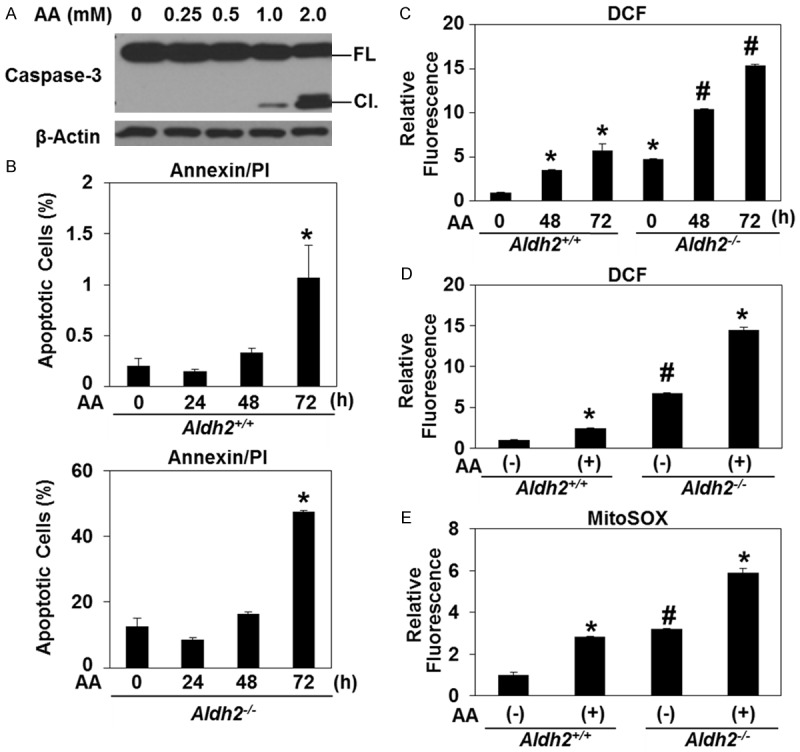
Figure 2.

ALDH2 level determines ROS generation and cytotoxicity in esophageal epithelial cells exposed to acetaldehyde. A. Immunoblot analysis was performed to assess Caspase-3 with β-Actin as a loading control in Aldh2 +/+ cells treated with acetaldehyde. B. Aldh2 +/+ and Aldh2 -/- cells were cultured in the presence of 1 mM of acetaldehyde for indicated time periods and then stained with Annexin-V and PI to assess apoptotic cells by flow cytometry. *p<0.05 (n=3) compared with 0 h. C. Aldh2 +/+ and Aldh2 -/- cells were cultured in the presence of 1 mM of acetaldehyde for indicated time periods and then stained with DCF to assess ROS by flow cytometry. *p<0.05 (n=3) compared with non-treatment, #p<0.05 (n=3) compared with WT non-treatment. D. Aldh2 +/+ and Aldh2 -/- cells were cultured in the presence of 1 mM of acetaldehyde for 48 hours and then stained with DCF to assess ROS by flow cytometry. *p<0.05 (n=3) compared with non-treatment, #p<0.05 (n=3) compared with WT non-treatment. E. Aldh2 +/+ and Aldh2 -/- cells were cultured in the presence of 1 mM of acetaldehyde for 48 hours and then stained with MitoSOX to assess ROS by flow cytometry. *p<0.05 (n=3) compared with non-treatment, #p<0.05 (n=3) compared with WT non-treatment.
