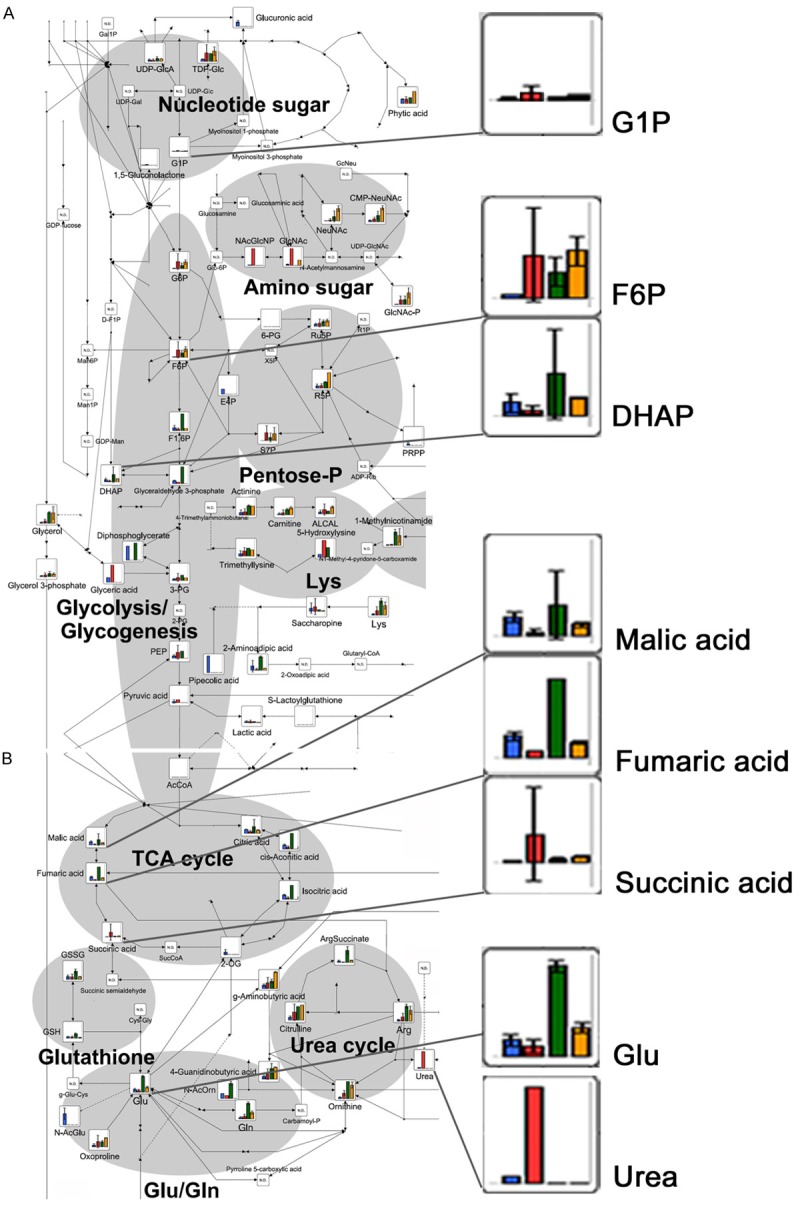
Figure 2.

CE-TOFMS analysis of intracellular metabolites related to the main energetic metabolic pathways after 24 h of exposure to acidosis: Bar graphs show the relative intracellular amount of metabolites. The bars correspond to the mean values of the three OS cell lines included in this study, under neutral (blue) and acidic (red) conditions, and to the mean of the two normal Fb cultures under neutral (green) and acidic conditions (orange), mean ± SD. Metabolic pathway maps were first written by VANTED software at HMT, and the copyright has been provided to the authors. A. Glycolysis/glycogenesis, pentose-phosphate, amino sugar and nucleotide sugar metabolic pathways; B. TCA and urea cycles, Glu/Gln metabolic pathway.
