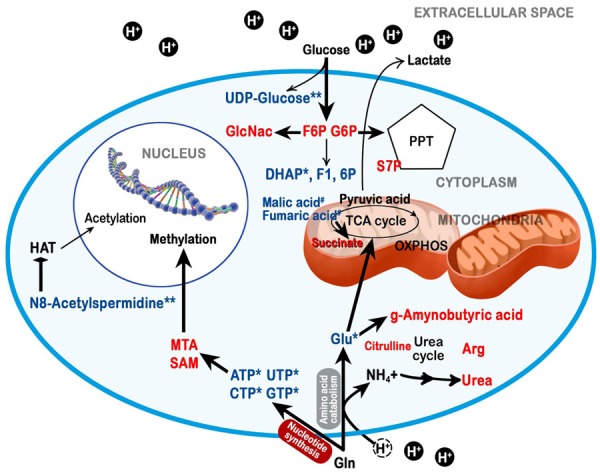
Figure 4.

Graphical representation of the metabolic adaptations under acidosis of OS cells, as revealed by the CE-TOFMS analysis: Intracellular metabolites of tumour cells cultured in acidic medium that are reduced (in blue) or increased (in red) compared with normal cells cultured in acidic medium (0.01 ≤ *p < 0.05 and **p < 0. 01), or with tumour cells cultured under neutral conditions (#p < 0.05). The graphics are original and made by the authors.
