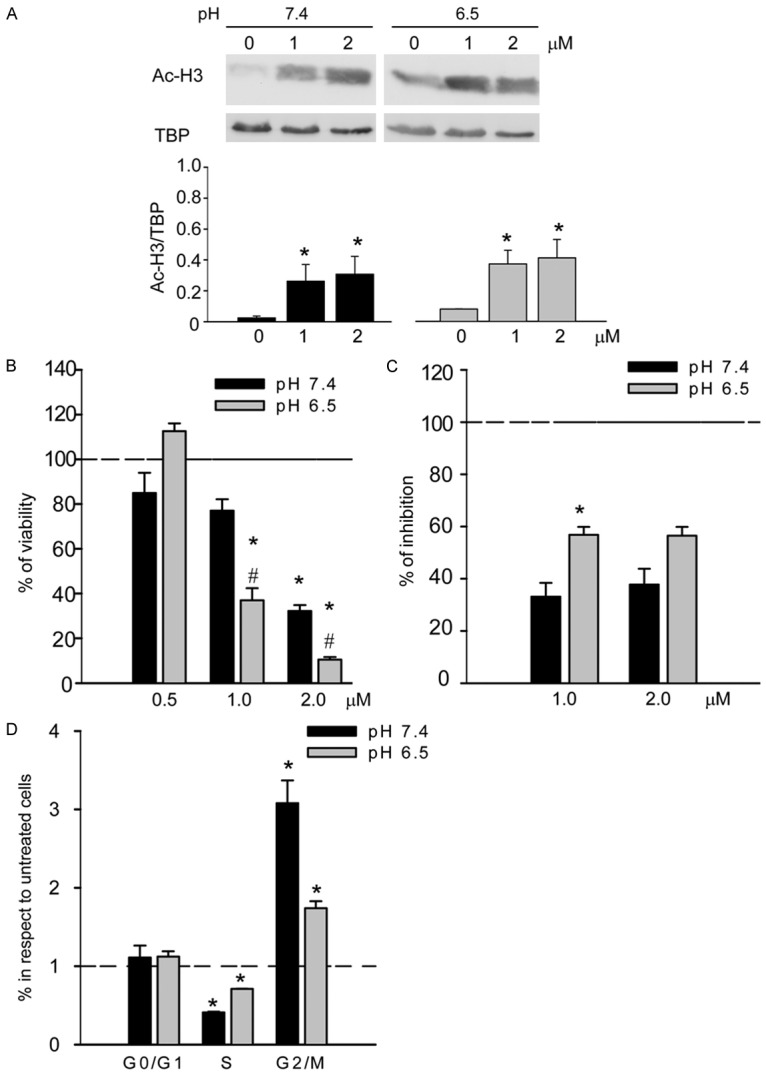
Figure 6.

Effect of class I/IIb HDACi on HOS osteosarcoma cells under acidosis: A. Western blotting analysis of the acetylation state of histone H3 after the treatment with the HDACi MC1742 at different pHs (upper panel, representative image; lower panel, graph relative to the quantification of the bands by software analysis; *p < 0.05, n = 3); B. Analysis of cell viability by acid phosphate indirect assay after the treatment with HDACi (mean ± SE, #p vs pH 7.4 at the respective concentration, *p vs. ctr. at the respective pH; # or *p < 0.05, n = 4); C. Analysis of the HDACi effect on the number of cells, counted after 72 h of treatment with different concentrations of HDACi. Percentages of inhibitions were calculated compared with untreated cells at the respective pH (mean ± SE, *p < 0.05, n = 3); D. Cell cycle analysis of HOS cells treated with HDACi 1 μM at different pHs. Ratio of percentages of treated/untreated cells at the respective pH, mean ± SE (*p < 0.05).
