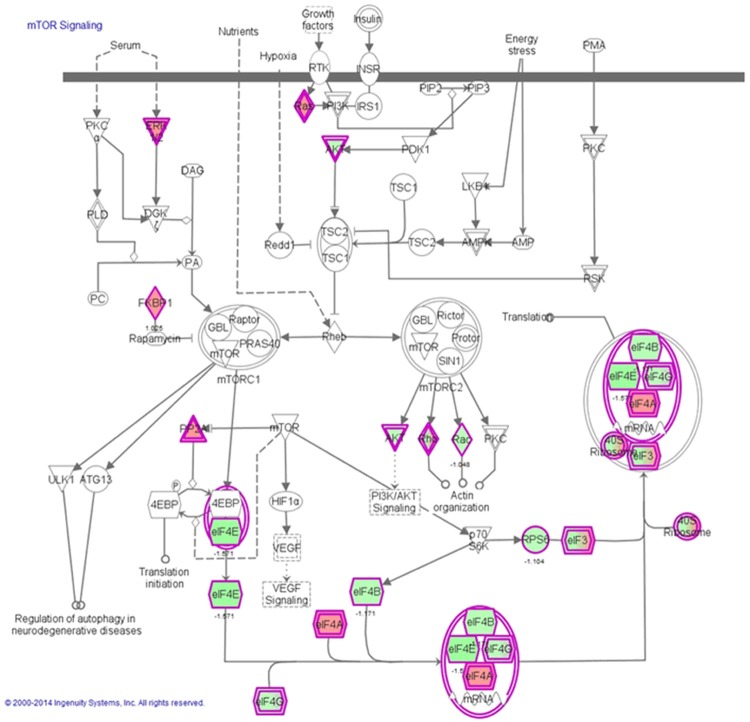
Figure 4.
mTOR signaling pathway regulated by CDDO-Me in Ec109 cells. Notes: Ec109 cells were treated with 0.5 μM CDDO-Me for 24 hours and the protein samples were subject to quantitative proteomic analysis. Red indicates an upregulation; green indicates a downregulation. The intensity of green and red molecule colors indicates the degree of down- or upregulation, respectively. Solid arrows indicate direct interaction and dashed arrows indicate indirect interaction. Abbreviation: CDDO-Me, methyl ester of 2-cyano-3,12-dioxoolean-1,9-dien-28-oic acid; mTOR, mammalian target of rapamycin.

